
Fig. 1. Methods to compare in vitro and in-cell IDP ensembles.
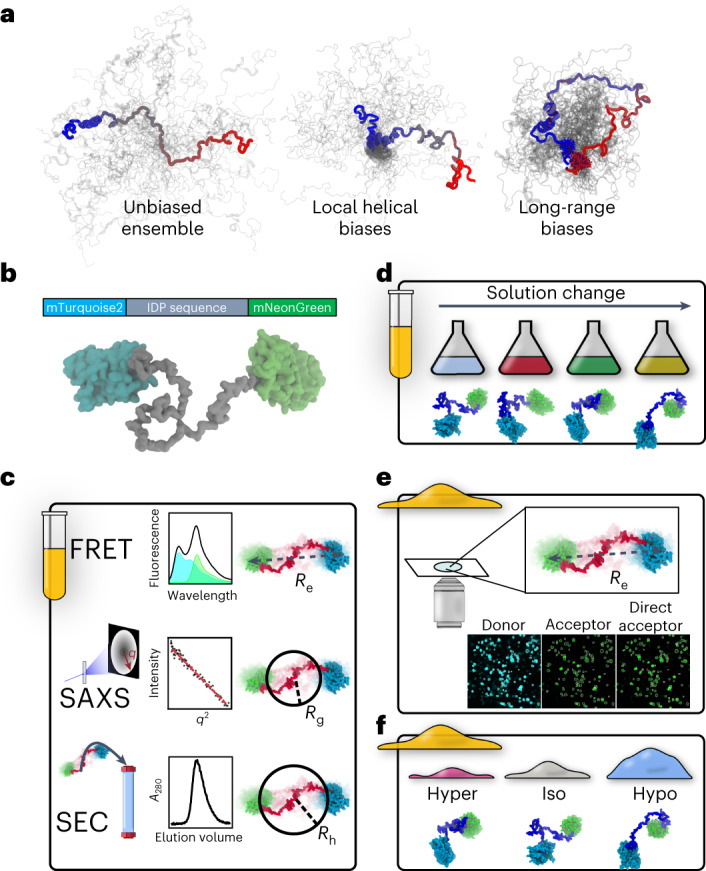
a, IDP ensembles with and without structural biases. In all schemes, a single conformation is shown in color and other conformations are shown in gray. Structural biases increase the density in specific regions of the ensemble and alter its average dimensions. b, FRET construct consisting of an IDP between two FPs that serve as a FRET donor and a FRET acceptor. c, In vitro experiments. Top: FRET. Middle: SAXS. Bottom: analytical SEC. d, In vitro solution space scanning measures the sensitivity of ensemble structure to changes in solution conditions. e, Live cell FRET microscopy is performed on cells expressing the same constructs used in vitro. f, Changes in ensemble dimensions are measured using live cell FRET following rapid hyperosmotic and hypoosmotic challenges. Hyper, hyperosmotic; Iso, isoosmotic; Hypo, hypoosmotic.