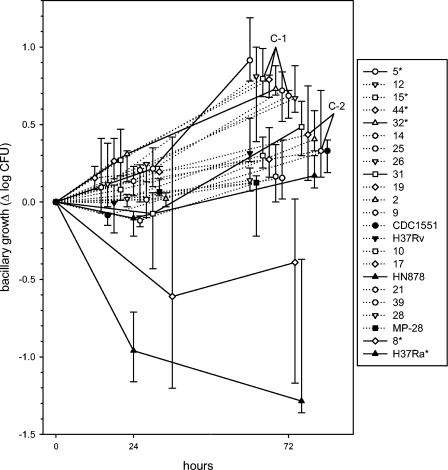
FIG. 4.
Kinetics of mycobacterial growth in whole blood cultures of 24 and 72 h, analyzed according to strain. Symbols indicate medians and IQRs for six subjects. The horizontal axis has been staggered to reduce overlap. Reference strains are indicated as filled symbols, and recent clinical isolates are indicated as open symbols. The listing of strains in the graph legend indicates their rank order according to growth after 72 h. Strains differed significantly by ANOVA after both 24 and 72 h (P < 0.001 for both). Strains 5, 15, 44, 32, 8, and H37Ra (indicated with asterisks) differed from H37Rv in post hoc testing. Two clusters of genetically identical or closely related strains (C-1 and C-2) are indicated.

