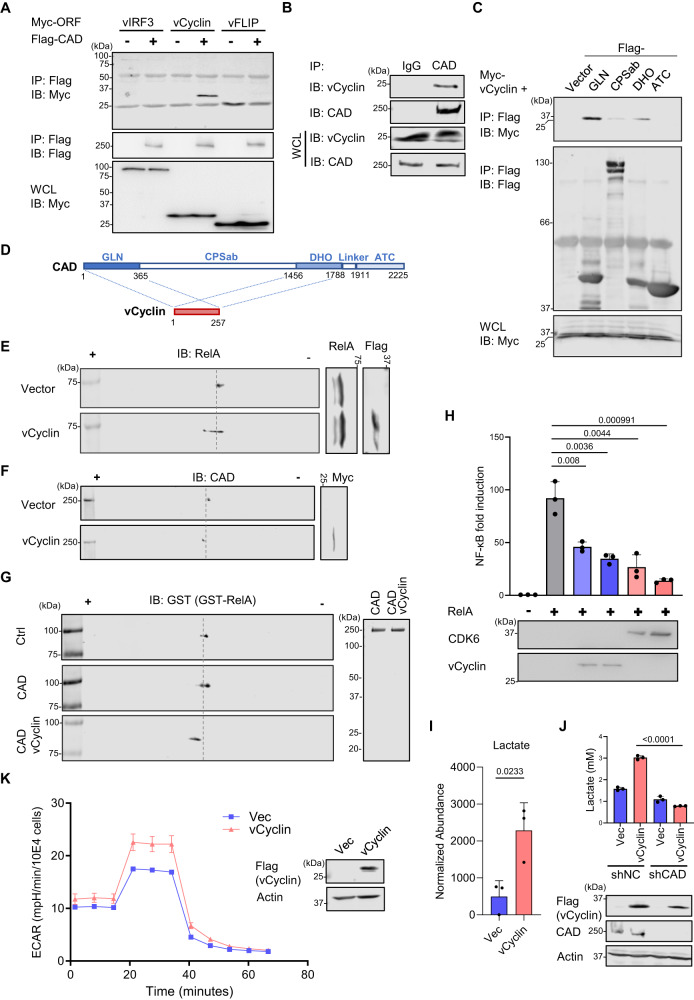
Fig. 2. KSHV vCyclin interacts with CAD and drives RelA deamidation.
A 293 T cells were transfected with plasmids expressing Flag-CAD and Myc-tagged KSHV latent proteins. WCLs were precipitated with anti-Flag. Precipitated proteins and WCLs were analyzed by immunoblotting with the indicated antibodies. B 293 T cells were infected with KSHV (MOI = 5) for 48 h. WCLs were precipitated with IgG or anti-CAD. Precipitated proteins and WCLs were analyzed by immunoblotting with the indicated antibodies. C, D 293 T cells were transfected with plasmids expressing vCyclin and Flag-tagged CAD truncation mutants. WCLs were precipitated with anti-Flag. Precipitated proteins and WCLs were analyzed by immunoblotting with the indicated antibodies (C) and the results were summarized in (D). E HOKs were infected with lentivirus containing Flag-tagged vCyclin. WCLs were prepared at 72 h and analyzed by 2DGE and immunoblotting. F 293 T cells were transfected with plasmids expressing Myc-vCyclin. WCLs were prepared at 48 h and analyzed by 2DGE and immunoblotting. G 293 T cells were transfected with plasmids expressing CAD with or without vCyclin for 48 h. CAD was then purified and analyzed by Coomassie staining (right panel). In vitro deamidation was performed with purified GST-RelA for 15 min, which was analyzed by 2DGE (left panel). H 293 T cells were transfected with the NF-κB reporter cocktail, a plasmid containing RelA, and increasing amounts of a plasmid containing vCyclin or CDK6. NF-κB activation was determined by luciferase assay at 30 h. I HOKs were infected with lentivirus containing vCyclin. Intracellular metabolites were extracted, and lactate was quantified by mass spectrometry. J 293 T cells were depleted of CAD by CAD-specific shRNA. The stable cells were then infected with lentivirus containing vCyclin. The culturing media were collected to determine lactate concentration at 16 h post medium replacement. K HOKs were infected with lentivirus containing vector control or vCyclin. Extracellular acidification rate (ECAR) was measured by Seahorse analyzer. Data are presented as mean ± SD of n = 3 biological replicates (2H-2K). Blots were representative of at least two independent experiments (2A-2C, 2E-2G). Significance was calculated using two-tailed, unpaired Student’s t-test. Source data are provided as a source data file. See also Fig. S2.

