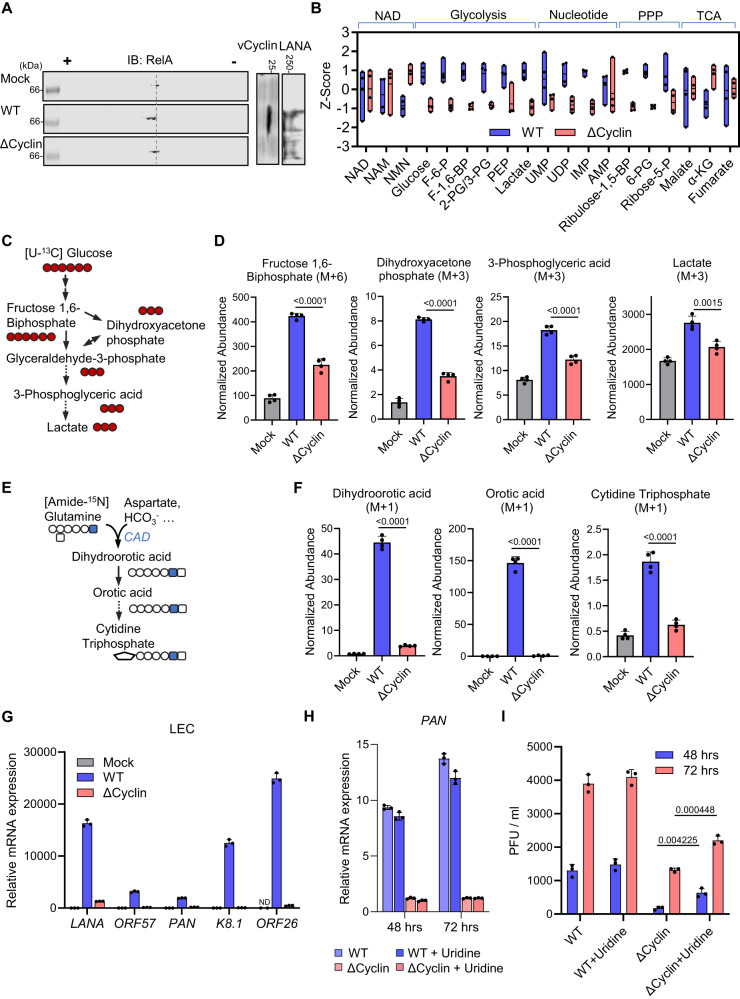
Fig. 3. Metabolic reprogramming by KSHV vCyclin.
A HOKs were infected with KSHV-wild-type (WT) or KSHV-vCyclin.STOP (∆Cyclin) (MOI = 30) for 48 h. WCLs were prepared and analyzed by 2DGE and immunoblotting. B HOKs were infected with KSHV-WT or KSHV-∆Cyclin (MOI = 30) for 48 h. Intracellular metabolites were extracted. NAD, glycolysis, nucleotide, pentose phosphate pathway (PPP), and TCA cycle intermediates were quantified by mass spectrometry and normalized by z-score. Data were presented as floating bars of n = 4 biological replicates. Bounds of box (bottom and top) represented min and max, and line represented mean. Full names of the metabolites are provided in the methods. C, D A diagram of the isotope labeling of glycolytic intermediates using [U-13C] glucose (C). Mass spectrometry analysis of intracellular glycolysis intermediates was performed at 15 min after labeling the HOKs pre-infected with KSHV-WT or KSHV-∆Cyclin (D). (M + a) indicates the mass of universally labeled glycolysis intermediates ( + a) with [U-13C] glucose. E, F A diagram of the isotope labeling of de novo pyrimidine synthesis intermediates using [Amide-15N] glutamine (E). Mass spectrometry analysis of pyrimidine intermediates was performed at 15 min after labeling the HOKs pre-infected with KSHV-WT or KSHV-∆Cyclin (F). (M + 1) indicates the mass of labeled pyrimidine intermediates ( + 1) with [Amide-15N] glutamine. G RT-qPCR analysis of the indicated viral mRNAs in LECs infected with KSHV-WT or KSHV-∆Cyclin (MOI = 10) for 72 h. ND: undetected. H RT-qPCR analysis of PAN mRNA in HOKs infected with KSHV-WT or KSHV-∆Cyclin (MOI = 30) for the indicated hours with or without uridine (10 µg/ml). I Viral titer in the medium was determined for the infected HOKs as shown in (H). Data are presented as mean ± SD of n = 4 biological replicates (3D and 3 F) and n = 3 biological replicates (3G-3I). Blots were representative of at least two independent experiments (3 A). Significance was calculated using two-tailed, unpaired Student’s t-test. Source data are provided as a source data file. See also Fig. S3.

