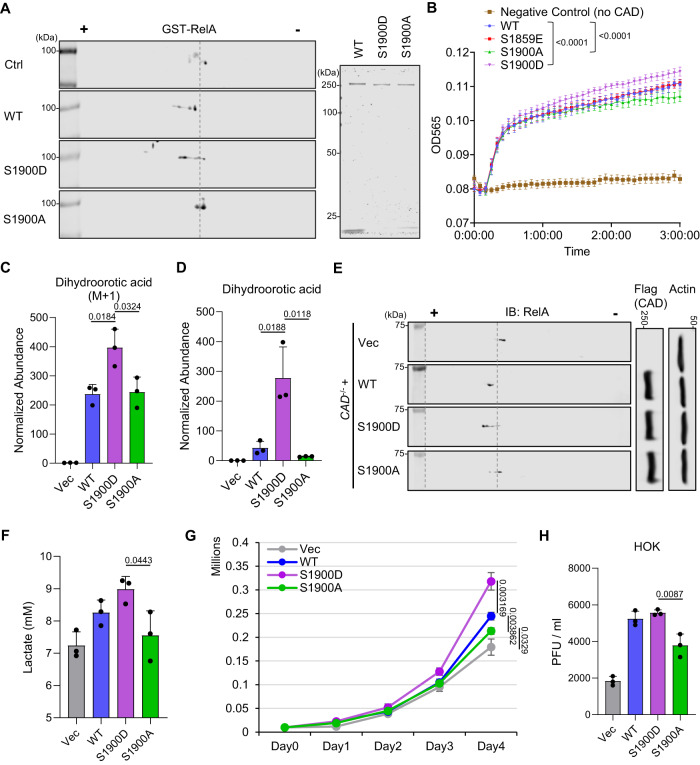
Fig. 5. CAD S1900 phosphorylation promotes metabolic reprogramming.
A In vitro deamidation was performed on purified GST-RelA with purified CAD wild-type (WT), CAD S1900D mutant (S1900D), or CAD S1900A mutant (S1900A) (Right), and analyzed by 2DGE with anti-GST antibody (Left). B CAD WT, S1900D, S1900A, and S1859E were purified from ectopically expressed 293 T cells. In vitro enzymatic (glutaminase) assay was performed. Glutamate concentration was quantified at 565 nm. C CAD-/- 293 T cells were reconstituted with CAD WT, S1900D, or S1900A by transient transfection for 48 h. Mass spectrometry analysis of 15N-labeled-dihydroorotic acid was performed at 15 min after labeling the cells with [Amide-15N] glutamine. D Mass spectrometry analysis of intracellular dihydroorotic acid was performed on the reconstituted CAD-/- 293 T cells as shown in (C). E WCLs were prepared from the reconstituted CAD-/- 293 T cells as shown in (C) and analyzed by 2DGE and immunoblotting. F 293 T cells were depleted of CAD by CAD-specific shRNA targeting 3’UTR. The stable cells were then transfected with plasmids expressing CAD WT, S1900D, or S1900A. The culturing media were collected from 1 ×10⁶ cells to determine lactate concentration at 20 h post medium replacement. G 1 ×10⁴ of the reconstituted 293 T cells as shown in (F) were seeded and cultured for a continuous 4 days and cell numbers were counted. H HOKs were depleted of CAD by CAD-specific shRNA targeting 3’UTR. The stable cells were then transfected with plasmids expressing CAD WT, S1900D, or S1900A, before infection with KSHV (MOI = 30). The viral titers in the culturing medium were determined 72 h post infection. Data are presented as mean ± SD of n = 3 biological replicates (5 C, 5D, 5F-5H) and mean ± SEM of n = 8 biological replicates (5B). Blots were representative of at least two independent experiments (5 A and 5E). Significance was calculated using two-tailed, unpaired Student’s t-test (paired t-test for 5B). Source data are provided as a source data file. See also Fig. S5.

