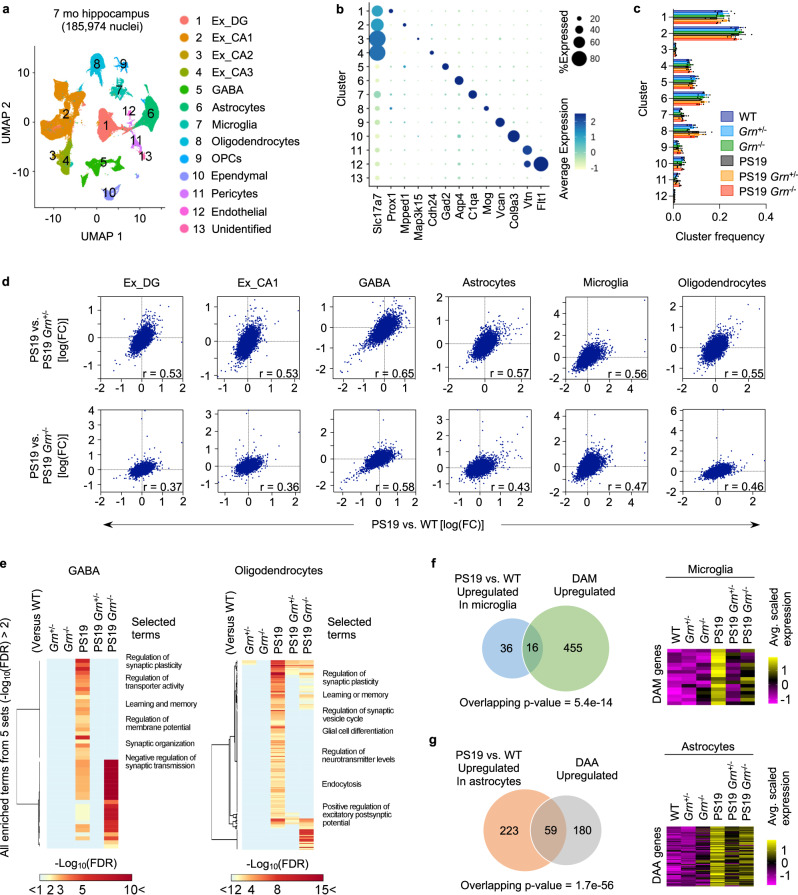
Fig. 2. PGRN reduction attenuates transcriptomic changes in PS19 mice.
a UMAP plot showing 13 cell type clusters of 185,974 single-nucleus RNA profiles from hippocampi of 6 genotypes (WT, Grn+/−, Grn−/−, PS19, PS19 Grn+/−, and PS19 Grn−/− mice) with three biological replicates at 7 months of age. b Dot plot showing the percent of cells expressing marker genes and average expression across all cell type clusters. c Quantification of frequency of each cluster in 6 genotypes. Mean ± SEM, n = 3 mice per genotype. No significant difference was observed between 6 genotypes in each cluster (One-way ANOVA). d Transcriptome-wide rescue/exacerbation plots showing the relationship between log(FC)s of genes in PS19 vs. WT and PS19 vs. PS19 Grn+/− or PS19 Grn−/− mice in the indicated cell clusters. Genes that express >1% of all nuclei in either genotype were used. The correlation coefficients (r) are indicated in the plots. All correlations were significant (p (two-tailed) <1e-15), although adjustments were not made for multiple comparisons. e Heatmaps showing values of –log10(FDR) of all enriched terms identified from 5 comparisons (Grn+/−, Grn−/−, PS19, PS19 Grn+/−, or PS19 Grn−/− vs. WT) (defined by –log10(FDR) > 2) in the same 5 comparisons in GABA and Oligodendrocytes cell type clusters. Selected terms are highlighted. f Effects of PGRN reduction on tau-induced expression of DAM-associated genes. Venn diagram shows the overlap between DEGs in PS19 microglia (vs. WT) and DAM-associated genes. Heatmap shows expression of the overlapping genes in microglia of 6 genotypes. Overlapping p-values was calculated by one-sided Fisher’s exact test. g Effects of PGRN reduction on tau-induced expression of DAA-associated genes. Venn diagram shows the overlap between DEGs in PS19 astrocytes (vs. WT) and DAA-associated genes. Heatmap shows expression of the overlapping genes in astrocytes of 6 genotypes. Overlapping p-values was calculated by one-sided Fisher’s exact test.

