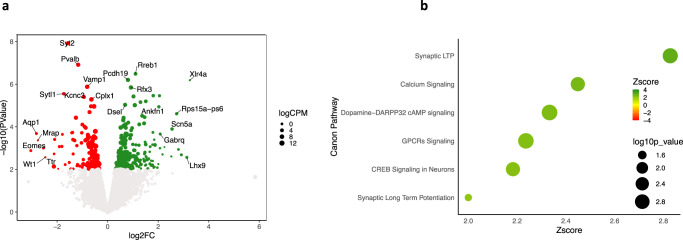
Fig. 2. Gene Ontology supports the view that KD alters synaptic plasticity in APP/PS1 mice.
a Volcano plot of differentially expressed genes (DEGs) induced by KD. Upregulated genes are shown in green, while downregulated genes are shown in red. Genes with log2FC greater than 2 or lower than −2 or the most significant are also labeled. The dimension of dots reflects the logCPM (logarithm of counts per million reads). b Ingenuity Pathway Analysis of genes influenced by diet. Canonical pathways with absolute z-score greater than 2 and −log p-value > 1.3 are reported in green, while dimensions of dots reflect FDR values as indicated in figure.

