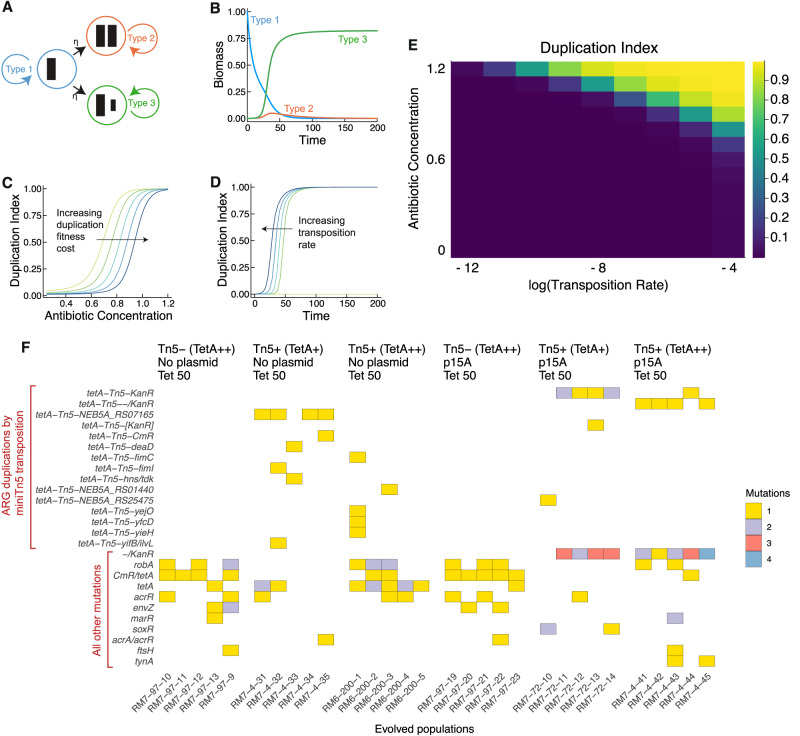
Fig. 1. Mathematical modeling and laboratory evolution with E. coli K-12 DH5α demonstrate that antibiotic selection is sufficient to drive the rapid evolution of antibiotic resistance through the duplication of antibiotic resistance genes.
Source data are provided in the Source Data File. A State diagram for the mathematical model. The three states represent cells with an ARG on the chromosome (Type 1), cells with an additional ARG on the chromosome due to duplication, including transposition-based mechanisms (Type 2), and cells with an ARG on the chromosome and an ARG on its plasmid due to transposition (Type 3). B Under sufficiently strong antibiotic selection and with low cost of expression, cells with ARGs on the plasmid dominate the population. The simulation result in this panel uses the following parameter settings (arbitrary units): Antibiotic Concentration A = 2.0, Duplication Cost c = 0.1, Transposition Rate η = 0.0002, Dilution Rate D = 0.1, Plasmid copy number y = 2 (Methods: Mathematical model). Under these conditions, the fitnesses of the three subpopulations are ordered . C Cells containing D-ARGs dominate population dynamics at sufficiently high antibiotic concentrations, even if the cost of maintaining the D-ARG varies. Duplication Index is defined as the fraction of cells containing D-ARGs. The simulation result in this panel uses the following parameter settings (arbitrary units): A = 2.0, η = 0.0002, D = 0.1, y = 2. Colors shift from yellow to blue as the fitness cost of carrying duplicated ARGs increases. The yellow curve represents Duplication Cost c = 0.05, and each successively darker curve represents an increment of 0.05, up to the darkest curve of c = 0.25. See Supplementary Data 1 for further details. D Increasing the transposition rate reduces the delay until strains with duplicated ARGs take over the population. The simulation result in this panel uses the following parameter settings (arbitrary units): A = 2.0, c = 0.1, D = 0.1, y = 2. Colors shift from yellow to blue as the transposition rate η increases. η is varied on a log-scale from 0, 2 × 10⁻⁶, 2 × 10⁻⁵, 2 × 10⁻⁴. E Duplicated ARGs establish in the population when both the transposition rate and antibiotic concentration are sufficiently high. As above, Duplication Index is defined as the fraction of cells containing D-ARGs. The simulation result in this panel uses the following parameter settings (arbitrary units): c = 0.1, D = 0.1, y = 2. Antibiotic concentration A is varied from 0.0 to 1.2 in increments of 0.1, and transposition rate η is varied on a log10-scale from 10−12 to 10−4. F Genome sequencing reveals targets of positive selection after 9 days of growth with increasing tetracycline concentrations up to 50 μg/mL tetracycline. Rows indicate genetic loci, and columns indicate replicate evolved populations. The color of each entry of the matrix represents the number of distinct mutations found at that locus in the population: yellow for one mutation, purple for two, red for three, and blue for four. Mutations involving the tetA-Tn5 mini-transposon have a tetA-Tn5- prefix.

