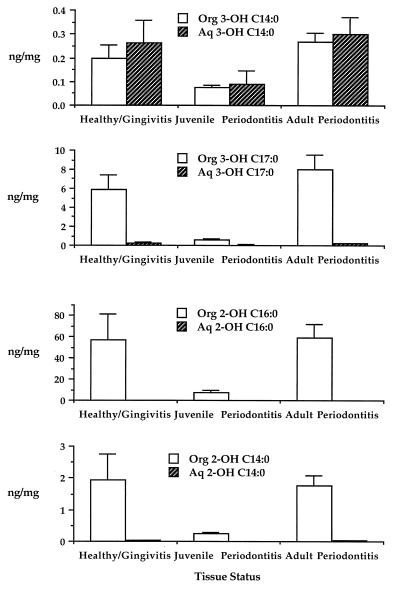
FIG. 4.
The distribution of 3-OH C14:0, 3-OH iC17:0, 2-OH C16:0, and 2-OH C14:0 in organic-solvent and aqueous extracts of the same gingival tissue samples shown in Fig. 2. Samples were extracted and processed for GC-MS analysis as described in Materials and Methods. Histogram bars show the recovery of hydroxy fatty acid (in nanograms per milligram of tissue) in organic-solvent extracts (Org) (open bars) and aqueous extracts (Aq) (cross-hatched bars). Each histogram bar represents the mean recovery of hydroxy fatty acid in the respective extract, with the error bar indicating the standard error of the mean.

