
Figure 4.
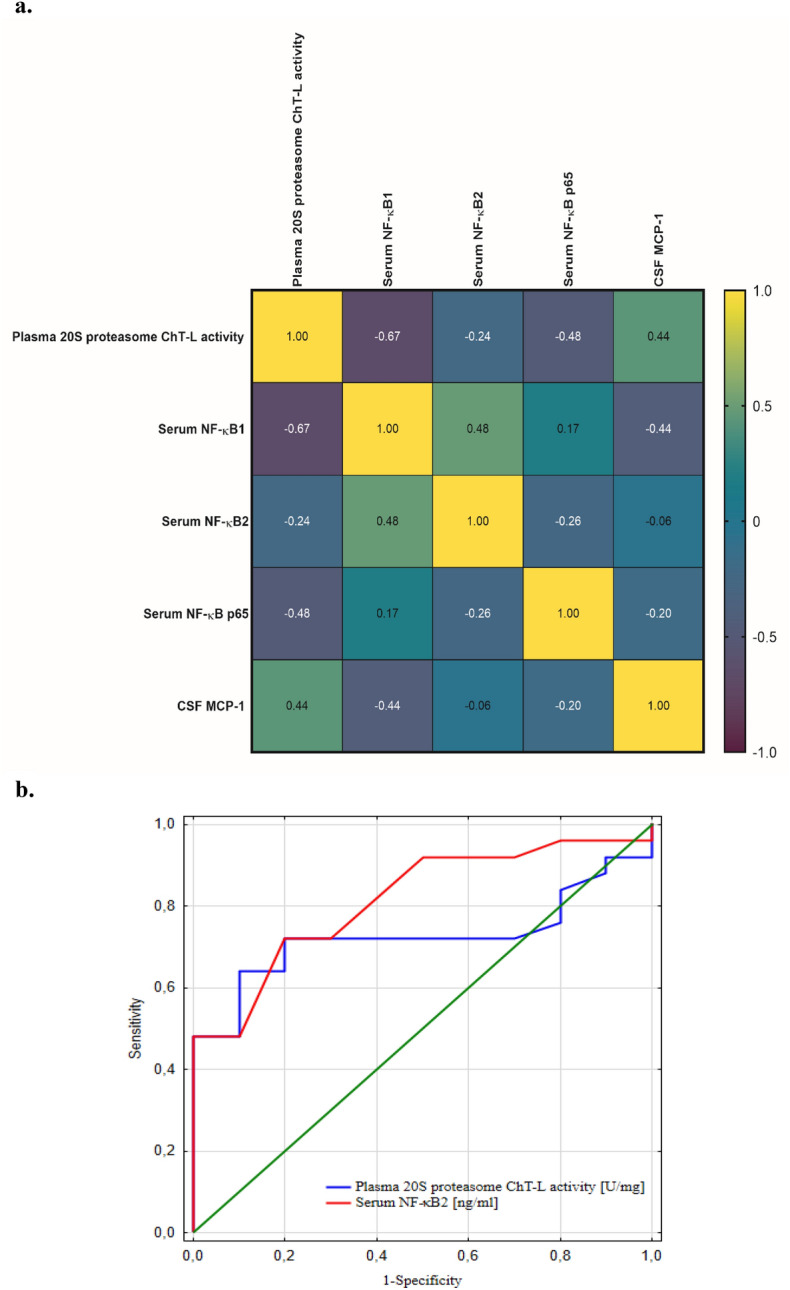
(a) The heat map of the complex relationship between plasma 20S proteasome ChT-L activity and serum NF-κB1 (p105), NF-κB2 (p100), NF-κB p65 and cerebrospinal fluid MCP-1 concentrations in UIA patients. The utilized color scale and the R values found in individual fields denote the strength and direction (no minus sign for positive correlation, with a minus sign for negative correlation) of the linear relationship between the two variables. Statistically significant dependencies for the examined parameters have been elucidated in the results section. (b) ROC curve for plasma 20S proteasome ChT-L activity and serum NF-κB2 (p100) concentration in differentiating UIA patients from control individuals without vascular lesions in the brain. Legend for Fig. 4a-b: ChT-L, chymotrypsin-like; MCP-1, Monocyte Chemoattractant Protein-1; NF-κB, nuclear factor kappa-light-chain-enhancer of activated B cells; ROC curve, receiver operating characteristic curve; UIA, unruptured intracranial aneurysm.