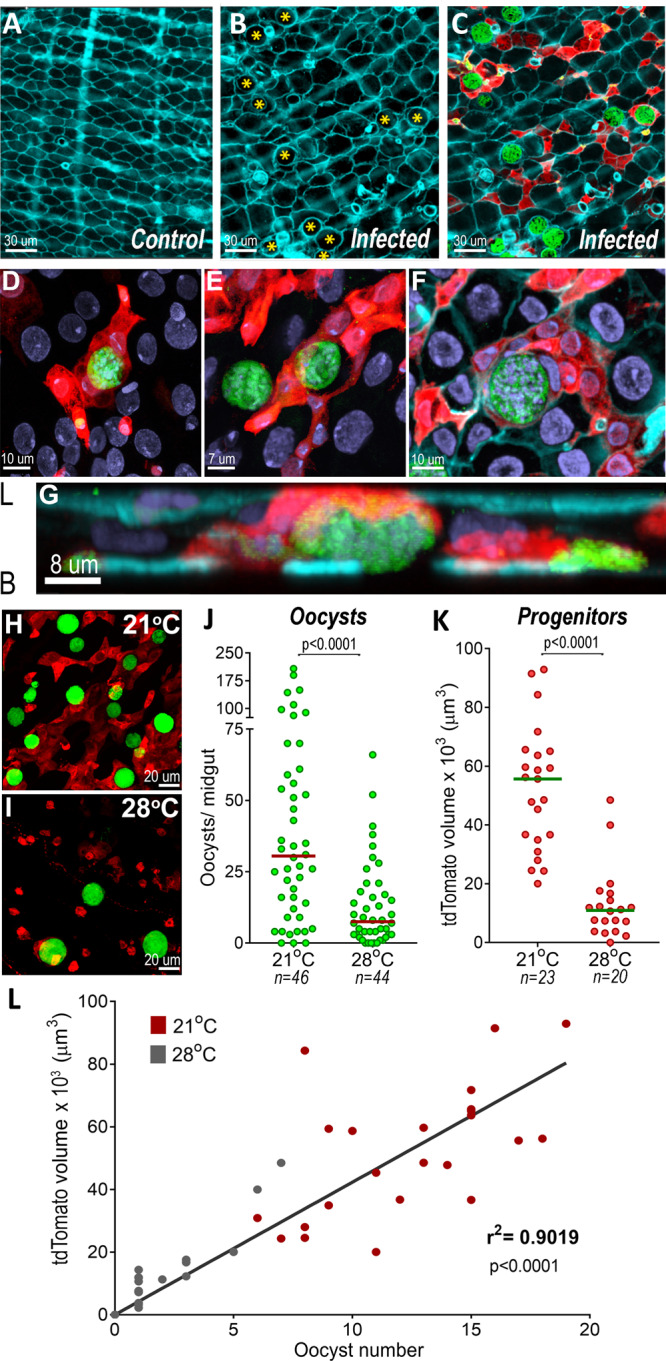
Fig. 2. Effect of Plasmodium infection on midgut architecture and of oocysts intensity of infection on proliferation of midgut progenitors.

A Actin staining of blood-fed control midguts. B Actin staining in P. berghei-infected midguts 10 days PI. Oocysts in the epithelia are indicated by yellow asterisks. C Actin staining (cyan), progenitors (red) and P.berghei oocysts (green). Scale bar: 30 µm. D, E Progenitor “ribbons” (red) surrounding oocysts (green), 10 days PI. F Actin (cyan) staining showing close association of progenitors (red) embedded in the epithelium with oocysts (green), 10 days PI. Scale bar: 10 µm. G Lateral view of (F), showing midgut progenitors (red) surrounding an oocyst 10 days PI. L = lumen and B = Basal. Micrographs are representative of experiments that were independently reproduced at least 2 times with multiple individuals in each experimental group obtained similar results. H Midgut progenitors and oocysts in the midgut of An. stephensi kept at (H) 21 °C and (I) 28 °C. J Oocysts counts of mosquitoes kept at 21 °C, a permissive temperature for oocyst development, and at 28 °C, a non-permissive one. Each dot represents the number of oocysts on individual midguts. The median is indicated by the horizontal line. Two-tailed Mann-Whitney U test (p < 0.0001). K Volume of tdTomato (tdTomato+ cells) 10 days PI of females kept at 21 °C and 28 °C. Each dot represents the volume of red fluorescence for individual midguts and the medians are indicated by the horizontal line. Two-tailed Mann Whitney U test (p < 0.0001). L Correlation of oocyst numbers and tdTomato volume (tdTomato+ cells) of midguts from females kept at 21 °C (red dots) and 28 °C (gray dots). Each dot represents an individual mosquito. Linear regression, r2 = 0.9019, p < 0.0001. The numerical data underlying the plots in the manuscript are provided as a Source Data File.
