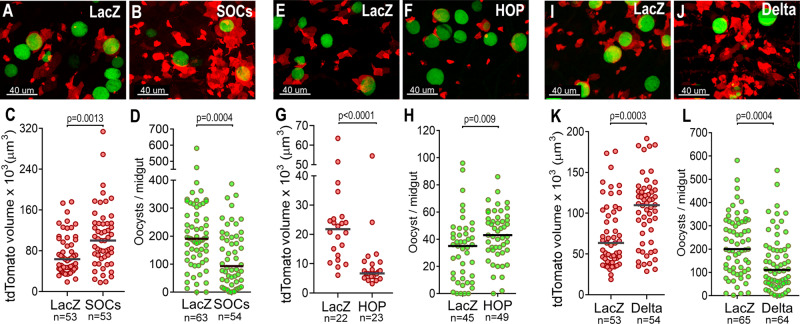
Fig. 3. Effect of proliferation of midgut progenitors on oocysts survival.
A LacZ and (B) SOCS-silenced midguts 10 days PI. C Volume of tdTomato (tdTomato+ cells) in lacZ and SOCS-silenced midguts 10 days PI (p = 0.0013). D Oocyst counts of lacZ, and SOCS silenced midguts 10 days PI (p = 0.0004). E lacZ and (F) HOP-silenced midguts 10 days PI. G Volume of tdTomato (tdTomato+ cells) in lacZ and HOP-silenced midguts 10 days PI (p < 0.0001). H Oocyst counts of lacZ and HOP-silenced midguts 10 days PI. I LacZ and (J) delta-silenced midguts 10 days PI (p = 0.009). K Volume of tdTomato (tdTomato+ cells) in lacZ and delta-silenced midguts 10 days PI (p = 0.0003). L Oocyst counts of lacZ and delta-silenced midguts 10 days PI (p = 0.0004). Each dot represents an individual mosquito. Median is indicated by the horizontal line. Two-tailed Mann Whitney U test. Midgut progenitors are shown in red and P. berghei oocysts in green. Scale bars: 40 µm. The numerical data underlying the plots in the manuscript are provided as a Source Data File. Micrographs are representative of experiments that were independently reproduced at least 2 times with multiple individuals in each experimental group and obtained similar results.

