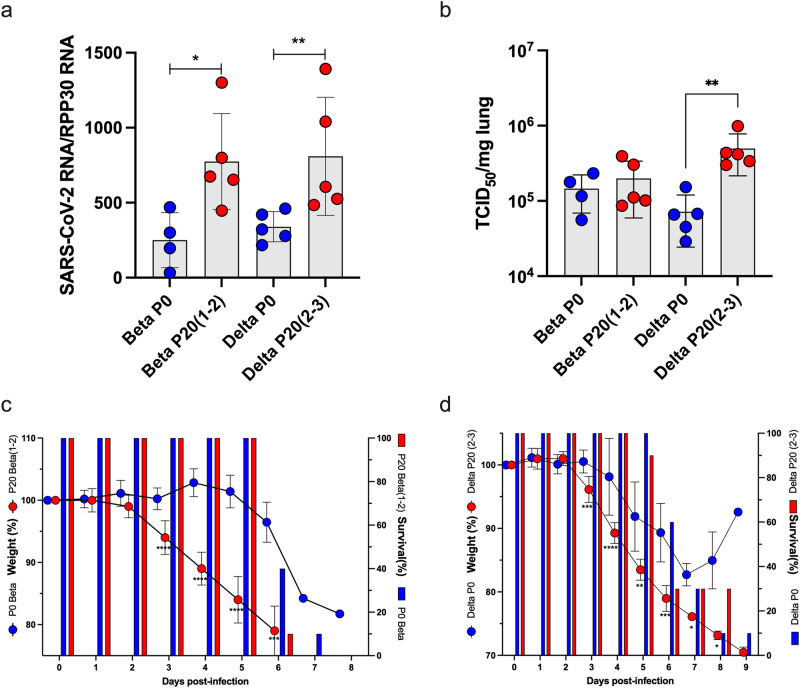
Fig. 2. Pathogenesis of P0 and P20 viruses in K18-ACE2 mice.
Mice (n = 15/group) were infected with 500 TCID50 of P0 or P20 (1-2) Beta and P20 (2-3) Delta viruses. a, b On day 3 post-infection, mice (n = 5) were euthanized and lungs collected for SARS-CoV-2 RNA (a) and infectious viral load (b) determination. Results are expressed as mean ± SD SARS-CoV-2 RNA copies/RPP30 RNA copies (a) and mean ± SD SARS-CoV-2 TCID50/mg of lung tissue (b). *p < 0.05 and **p < 0.008 as determined using non-parametric two-sided Mann–Whitney test. c, d The weight and survival of each mouse (n = 10/group) was monitored daily throughout the experiment. Weights are reported as mean percentage ± SD of weight relative to day 0. The percent survival in each group is presented. *p < 0.05, **p < 0.01, ***p < 0.001, ****p < 0.0001 as determined using unpaired, two-tailed t-tests assuming no difference between groups.

