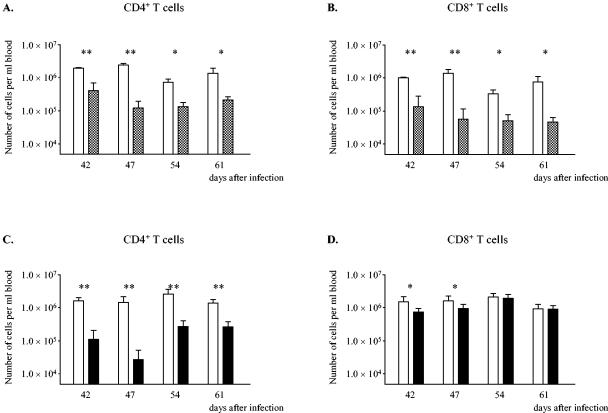
FIG. 2.
Numbers of CD4+ T cells (A and C) and CD8+ T cells (B and D) per ml of blood of C3H/HeN control mice infected with S. enterica serovar Typhimurium (open bars), mice that received total-body irradiation (cross-hatched bars), and mice that were depleted of CD4+ T cells (solid bars). The numbers of CD4+ and CD8+ T cells were calculated by combining data from leukocyte counts, cell differentiation analysis, and FACS analysis. Two asterisks indicate that the P value is <0.005, and one asterisk indicates that the P value is <0.05.

