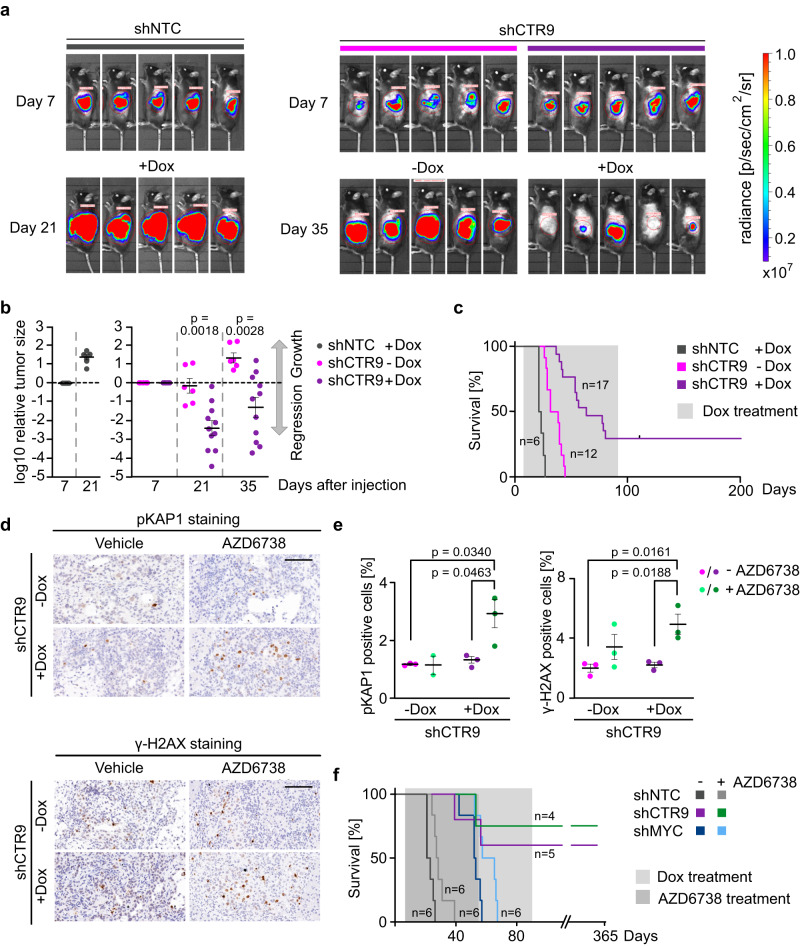
Fig. 4. CTR9 is required for PDAC growth.
a Luciferase imaging of KPC-cell–derived tumors expressing NTC (non-targeting control) shRNA or shRNA against CTR9 upon orthotopic transplantation into C57BL/6 J mice. Doxycycline treatment was started 7 days after transplantation. Luciferase activity is shown at day 7 after transplantation and after 2 or 4 weeks of doxycycline treatment. b Change of tumor size of KPC tumors expressing doxycycline-inducible shNTC (left) or shCTR9 (right) relative to the start of doxycycline treatment on day 7. The plot shows the log10 of the ratio of luciferase activity at the indicated times relative to day 7. Results are presented as mean ± S.E.M. P values were calculated using the unpaired two-sided t-test. n = 6 mice for shNTC+Dox and shCTR9-Dox, while n = 11 mice for shCTR9+Dox. c Kaplan–Meier plot of mice transplanted with KPC cells expressing doxycycline-inducible shCTR9 or shNTC. Doxycycline was added to the food for 12 weeks as indicated. d Immunohistochemistry of pancreatic tumors expressing shRNA against CTR9. Mice were treated for 3 days with or without doxycycline and AZD6738 or vehicle. Sections were stained with anti-pKAP1 and anti-γ-H2AX antibodies. Scale bar: 100 µm. e Percentage of pKAP1 or γ-H2AX positive cells present in the tumor tissue. Positive cells were counted after 3 days of CTR9 depletion and AZD6738 treatment. Results are presented as mean ± S.E.M. Each dot represents an independent tumor and P values were calculated using the unpaired two-sided t-test. n = 3 independent tumors except for pKAP1 staining of AZD6738 treated mice, n = 2. f Kaplan–Meier plot of mice transplanted with KPC cells expressing doxycycline-inducible shCTR9, shMYC or shNTC. Expression of shRNAs was induced with doxycycline from day 7 for 12 weeks in all mice. Mice were treated with AZD6738 or vehicle from day 7 for 7 weeks. Source data are provided as a Source Data file.

