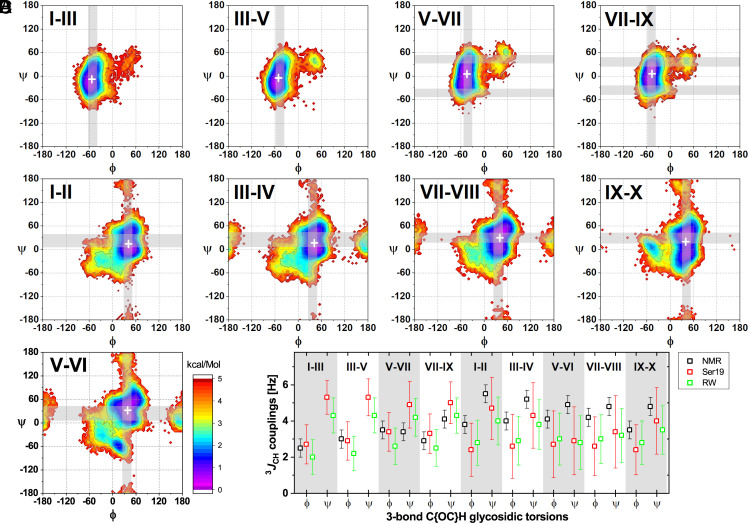
Fig. 2.
GXM10-Ac3 Transglycosidic torsion and 3JCH-couplings analysis. (A–C) Torsion energy heatmaps generated from the MD trajectory. The most likely predicted (low-energy) conformations are denoted in purple/blue (<2 kcal/mol). Gray bands correspond to predicted torsion values from experimental 3JCH NMR values utilizing the Karplus equation as parameterized in ref. 39, which best agree with average MD trajectory torsions (white ‘+’). SI Appendix, Table S3, further details all calculated torsions. (A) Results for Man-Man backbone linkages. (B) Energy maps for Xyl-Man branched linkages. (C) Analysis for the GlcA-Man branch linkage. (D) Comparison of measured 3JCH values to MD predicted mean values using two recent approaches (Materials and Methods).

