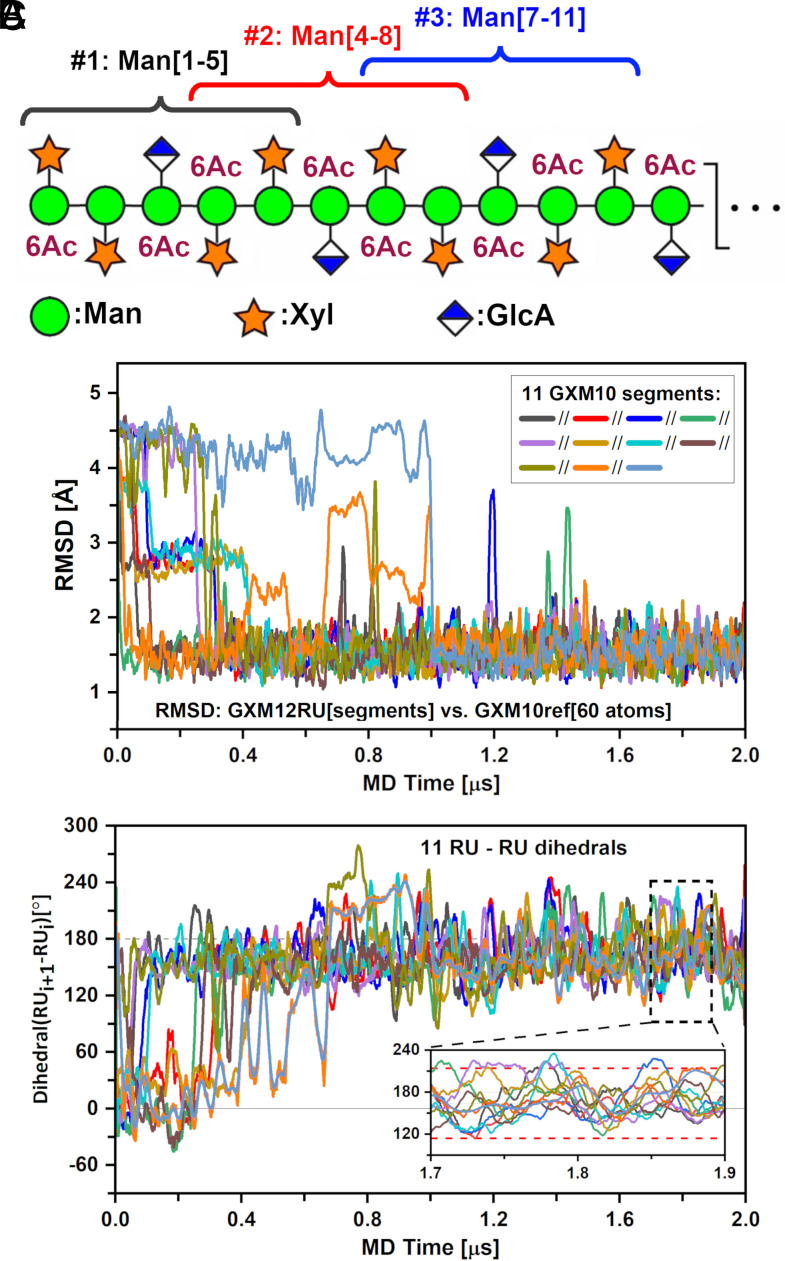
Fig. 4.
GXM-12RU (M2 motif) PS MD characterization. (A) Scheme of GXM12-RU PS first four RUs (CFG notation), highlighting overlapping GXM10-Ac3 units, assessed over a 2 μs MD trajectory. (B) rmsd of PS segments against GXM10ref. After ~1.5 μs, all segments converged to a low rmsd ~1.5 Å. (C) Analysis of the rotation pitch of the RUs, using dihedrals between consecutive GlcA glycans (represented by Man{C2}-GlcA{C4} vectors). Averaged values converge to ~164° ± 50° toward the end of the simulation (indicated on Inset with red dashed lines). In both (B) and (C) curves were smoothed using 20 ns running windows average for clarity.

