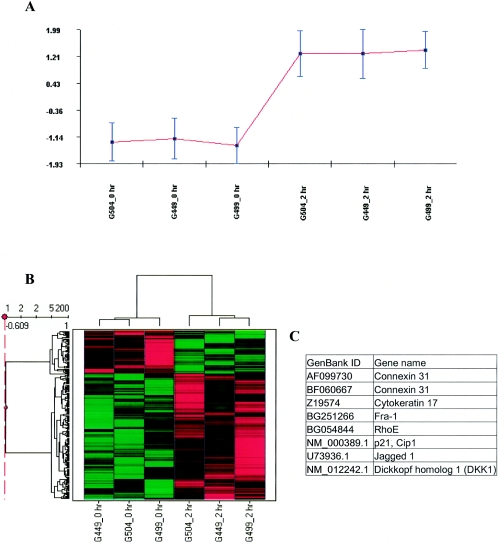
FIG. 1.
Hierarchical clusters of genes from Act-treated intestinal epithelial cells (HT-29). Hierarchical cluster analysis was performed on signal values from six arrays (0 and 2 h replicate experiments) using CLUSFAVOR 6.0, Spotfire DecisionSite 7.3, and Arrayminer5. The Cluster/Treeview software programs were used to cluster fold change values generated from three experimental comparisons with human intestinal epithelial cells (3 replicates of 0 versus 2 h). (A) Graphical representation of a cluster generated by using CLUSFAVOR 6.0 that represents a set of genes upregulated by 2 h in Act-treated human intestinal epithelial cells. Normalized intensity values are displayed on the ordinate, and the abscissa represents each experiment. G449, G499, and G504 represent the three independent experimental array sets (0 and 2 h) with human intestinal epithelial cells. (B) Clustering generated by using Spotfire DecisionSite 7.3 showing a set of upregulated genes (similar to that generated by CLUSFAVOR 6.0). Higher signal values are shown in red, and lower signal values are shown in green. Black represents median signal values. (C) List of genes upregulated by 2 h specifically in Act-treated human intestinal epithelial cells that clustered together for all four clustering programs used (Cluster/Treeview, CLUSFAVOR 6.0, Spotfire DecisionSite 7.3, and ArrayMiner5).

