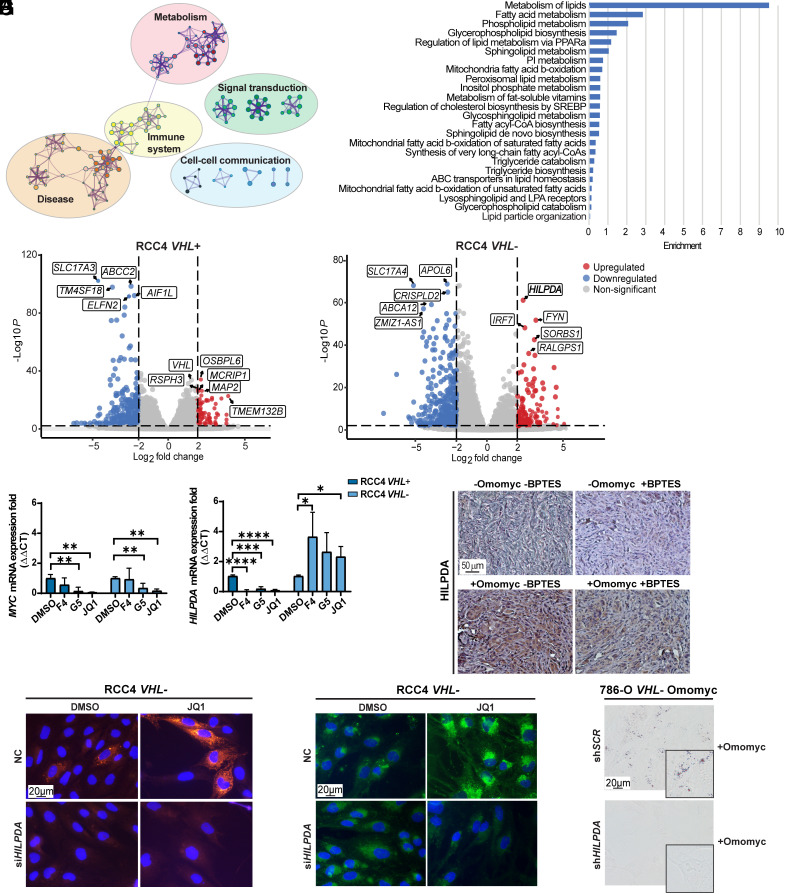
Fig. 5.
The HILPDA gene is up-regulated in RCC4 VHL− cells after MYC inhibition. (A) Visualization of functional enrichment maps in JQ1− versus DMSO-treated RCC4 VHL− cells (n = 3). The nodes represent significantly enriched genes participating in indicated processes. (B) Bar plot of the most significantly changed lipid metabolic processes in JQ1− versus DMSO-treated RCC4 VHL− cells. (C) Volcano plot (P < 0.05, horizontal dotted line) of the log2 fold change (<−2, >+2, vertical dotted lines) of expression of genes between JQ1− and DMSO-treated RCC4 VHL+ cells (Left plot) and RCC4 VHL− cells (Right plot). The five most down-regulated (blue) and up-regulated (red) genes in each cell line are boxed. Not significantly changed genes are depicted in gray. (D) RT-qPCR of MYC and HILPDA in RCC4 VHL+ and VHL− cells. B2M was used as housekeeping gene. Data are presented as mean ± SD (n = 3). Statistical analysis: one-way ANOVA with *, **, ***, and **** indicating P < 0.05, <0.01, <0.001, and <0.0001, respectively. (E) Immunohistochemistry analysis of tumor sections stained with anti-HILPDA. (Scale bar: 50 μm.) (F) Immunofluorescence staining of HILPDA and (G) lipid droplet staining in RCC4 VHL− negative control (NC) and siHILPDA cells after treatment with DMSO or JQ1. Green: LD-BTD1; red: HILPDA; blue: DAPI. (Scale bar: 20 μm.) (H) Bright-field images of lipid droplet staining with Oil-red O (red) in 786-O VHL− Omomyc shSCR and shHILPDA cells upon Omomyc induction. (Scale bar: 20 μm.) Images in E–H are representative of three independent replicates/sections.

