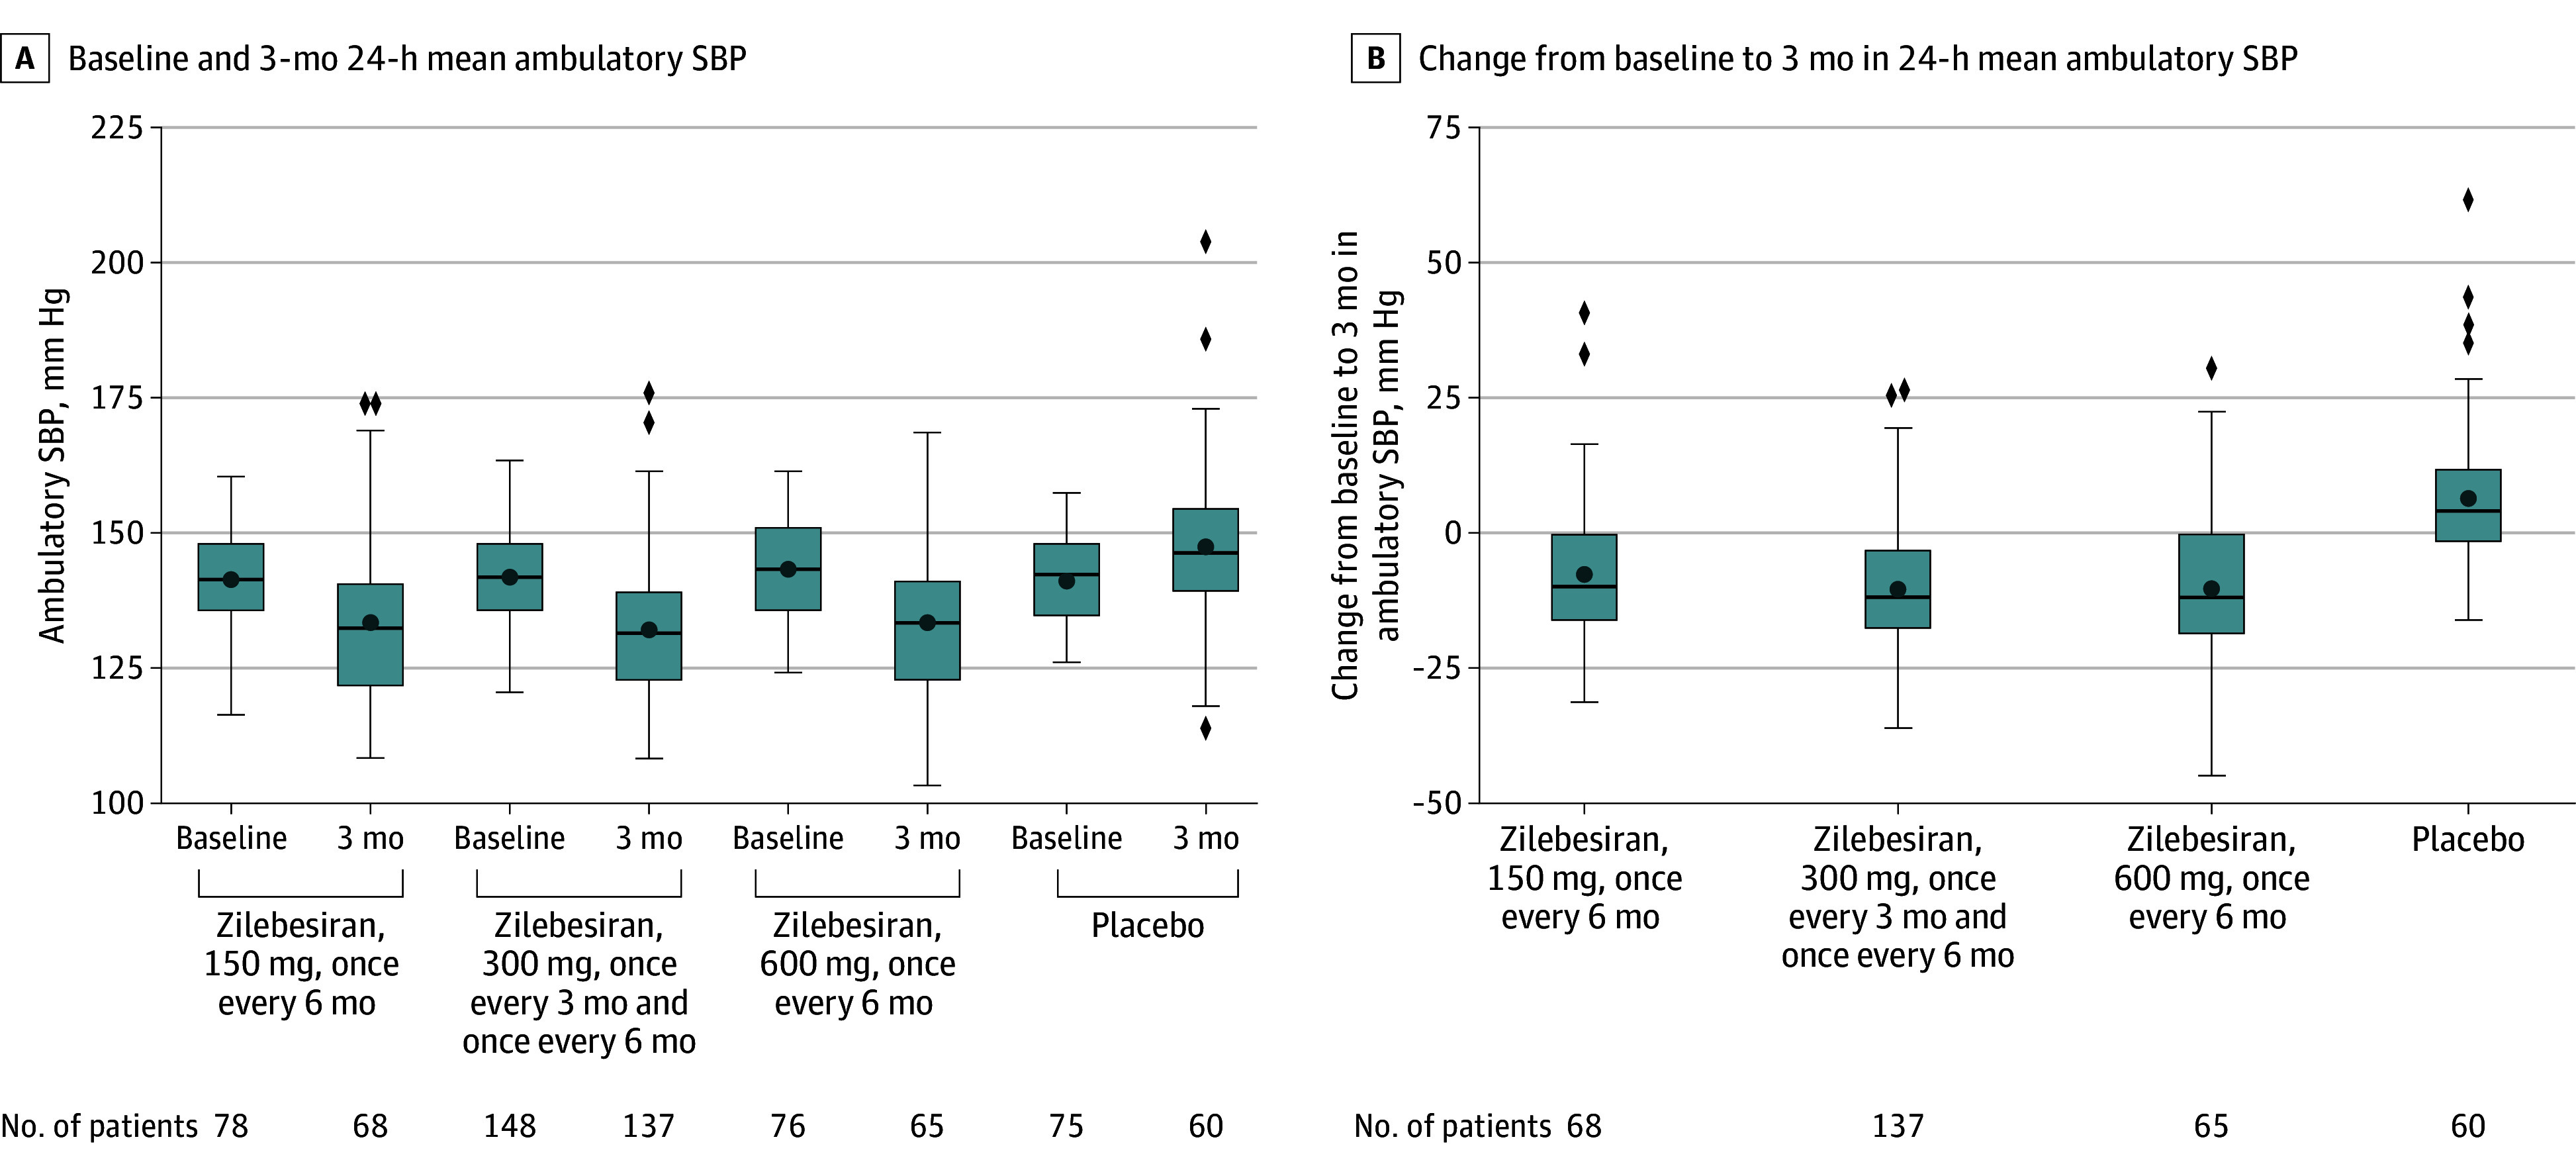
Figure 2. Ambulatory Systolic Blood Pressure (SBP) Among the Full Analysis Seta.

aAll randomized patients who received any amount of study drug, analyzed according to randomized treatment.
Box plots demonstrate median (thick horizontal line), mean (circle), IQR (box top and bottom), highest and lowest values within 1.5 × the IQR (whiskers), and more extreme values (diamonds). For the efficacy analyses of end points assessed at month 3, the zilebesiran 300 mg and 600 mg groups were combined because both had received the same zilebesiran dose.
