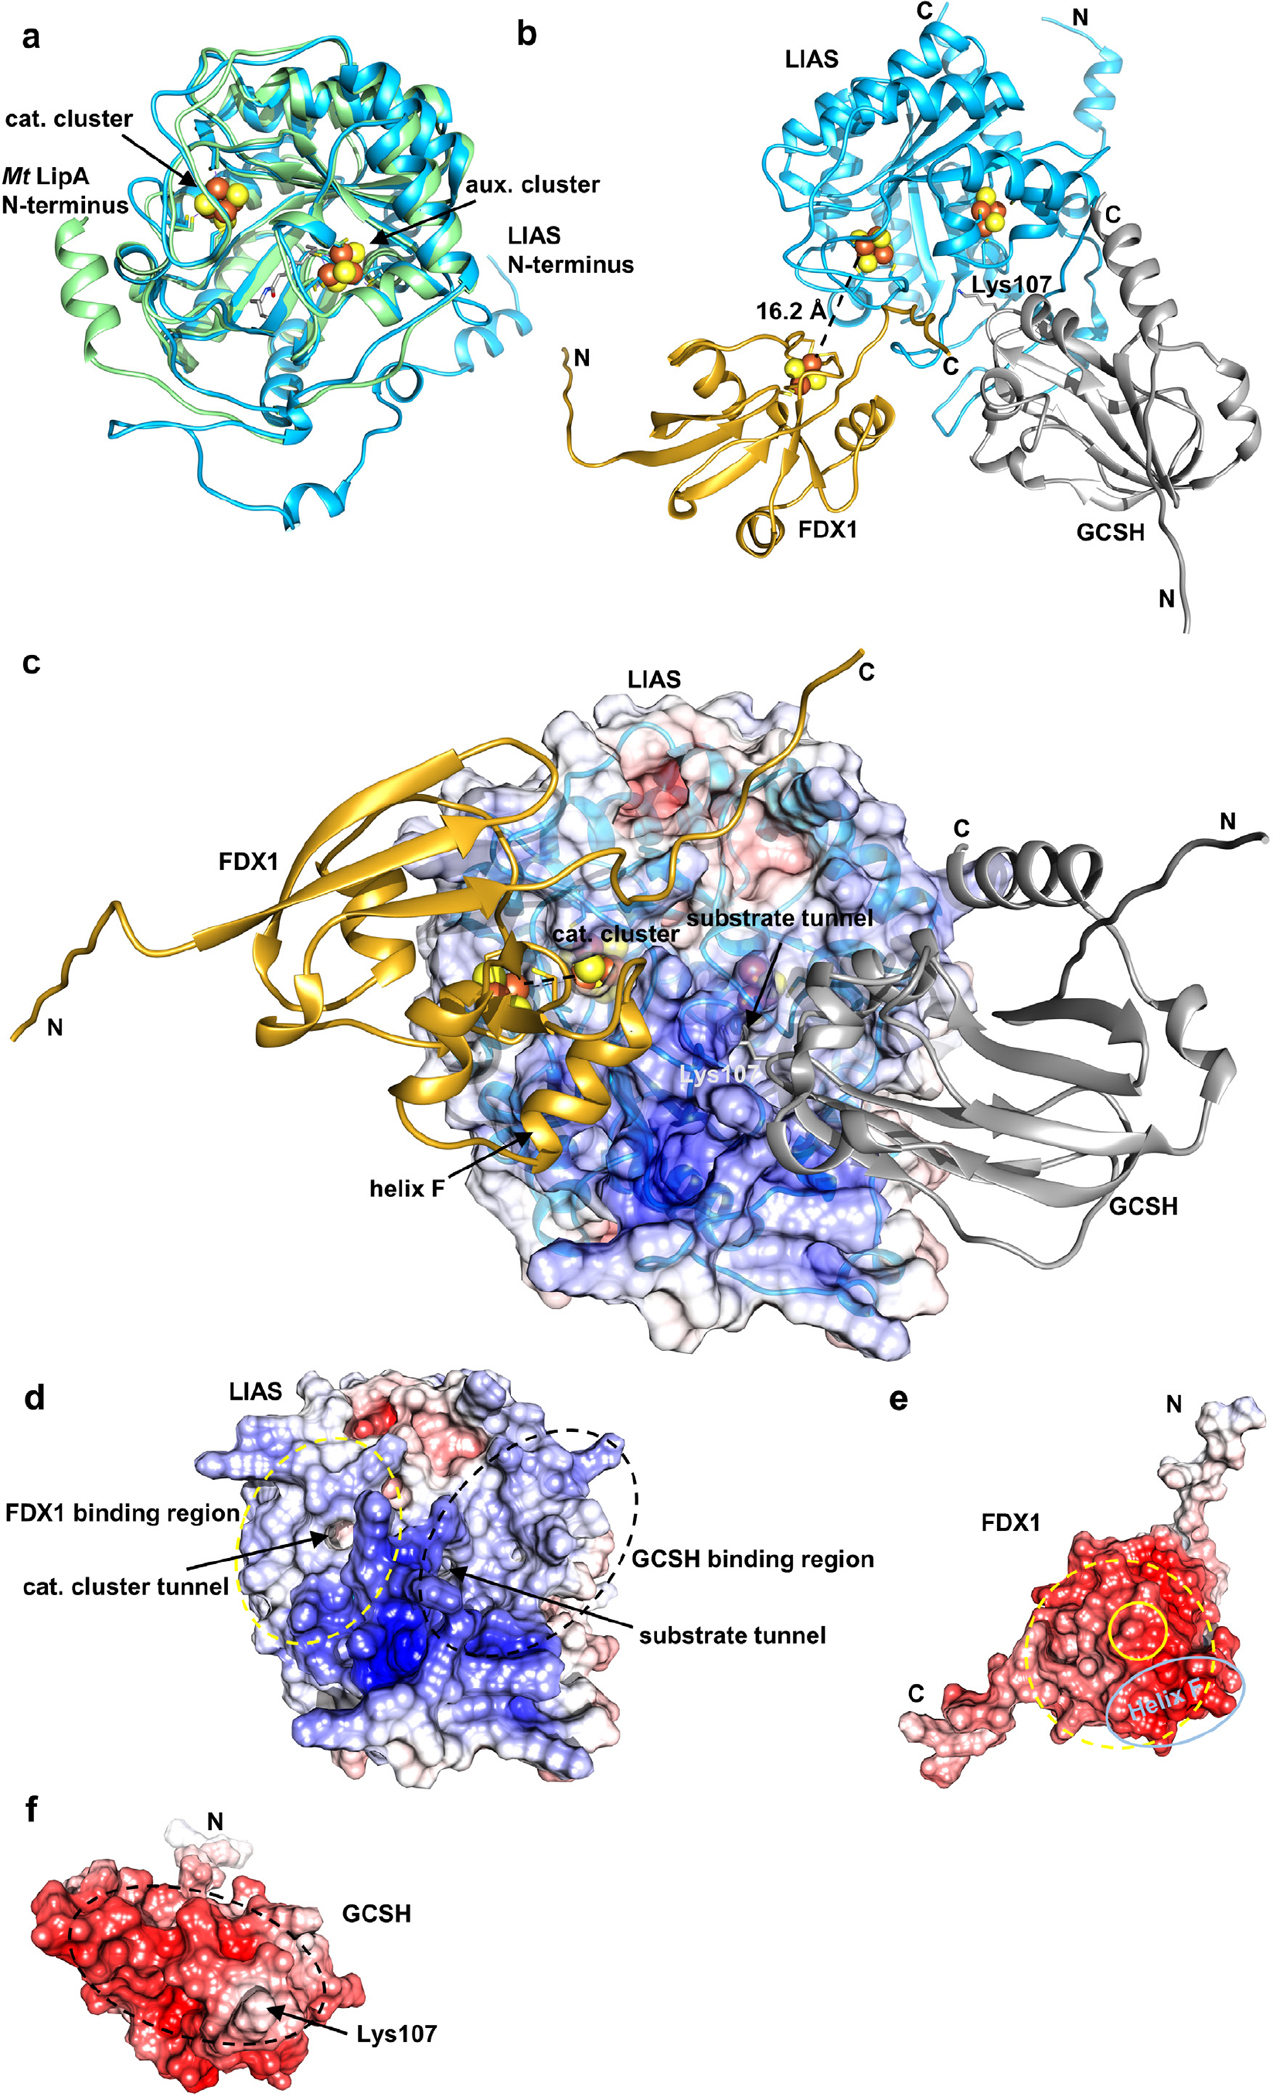
Extended data Figure 10 |. Alphafold2 predicts a functionally meaningful structure for the trimeric LIAS-GCSH-FDX1 complex.

Structures of human LIAS, GCSH, and FDX1, and of complexes were predicted with Google Colab and the top-scoring prediction is displayed (https://colab.research.google.com/github/sokrypton/ColabFold/blob/main/beta/AlphaFold2_advanced.ipynb). a Overlay of the predicted LIAS structure (blue, residues: 29–372) with Mycobacterium tuberculosis LipA (PDB code: 5EXK, green). The Mt LipA catalytic (cat.) and auxiliary (aux.) cluster are displayed as spheres and its bound 6-thiooctanoyllysyl (thiooct) moiety as grey sticks. b-c Modeling of the LIAS-GCSH-FDX1 complex (residues: LIAS, 29–372; GCSH, 41–173; FDX1, 54–184) predicted a functionally meaningful complex, where GCSH inserts its lipoyl-carrying residue Lys107 into the octanoyl substrate entry tunnel of LIAS. The position of the [2Fe-2S] cluster of FDX1 is consistent with electron transfer to the catalytic [4Fe-4S] cluster of LIAS. Fe/S cluster-coordinating residues and GCSH Lys107 are shown as sticks. Positions of Fe/S clusters are modelled based on crystal structures of FDX1 (PDB code: 3P1M) and Mt LipA (PDB code: 5EXK). LIAS, blue; GCSH, grey; FDX1, gold. In (c) the electrostatic surface potential is mapped onto the half transparent surface of LIAS. When we instead modeled a trimeric LIAS-GCSH-FDX2 complex, binding of FDX2 was predicted at the substrate tunnel of LIAS. This would block substrate-product delivery by GCSH. GCSH interacted with FDX2, but hardly with LIAS in this case. Overall, no physiologically relevant complex could be modeled in presence of FDX2. d-f Electrostatic surfaces mapped onto LIAS (d), FDX1 (e) and GCSH (f). LIAS-FDX1 and LIAS-GCSH interacting regions are encircled by yellow and black dashed lines, respectively. The location of the FDX1 [2Fe-2S] cluster and helix F are encircled by yellow and light blue solid lines, respectively. Surface potentials were calculated using the APBS server (https://server.poissonboltzmann.org). Negative charges are colored in red, positive charges in blue. The color bar covers the range from −10 kT/e to +10 kT/e. N and C termini are indicated.
