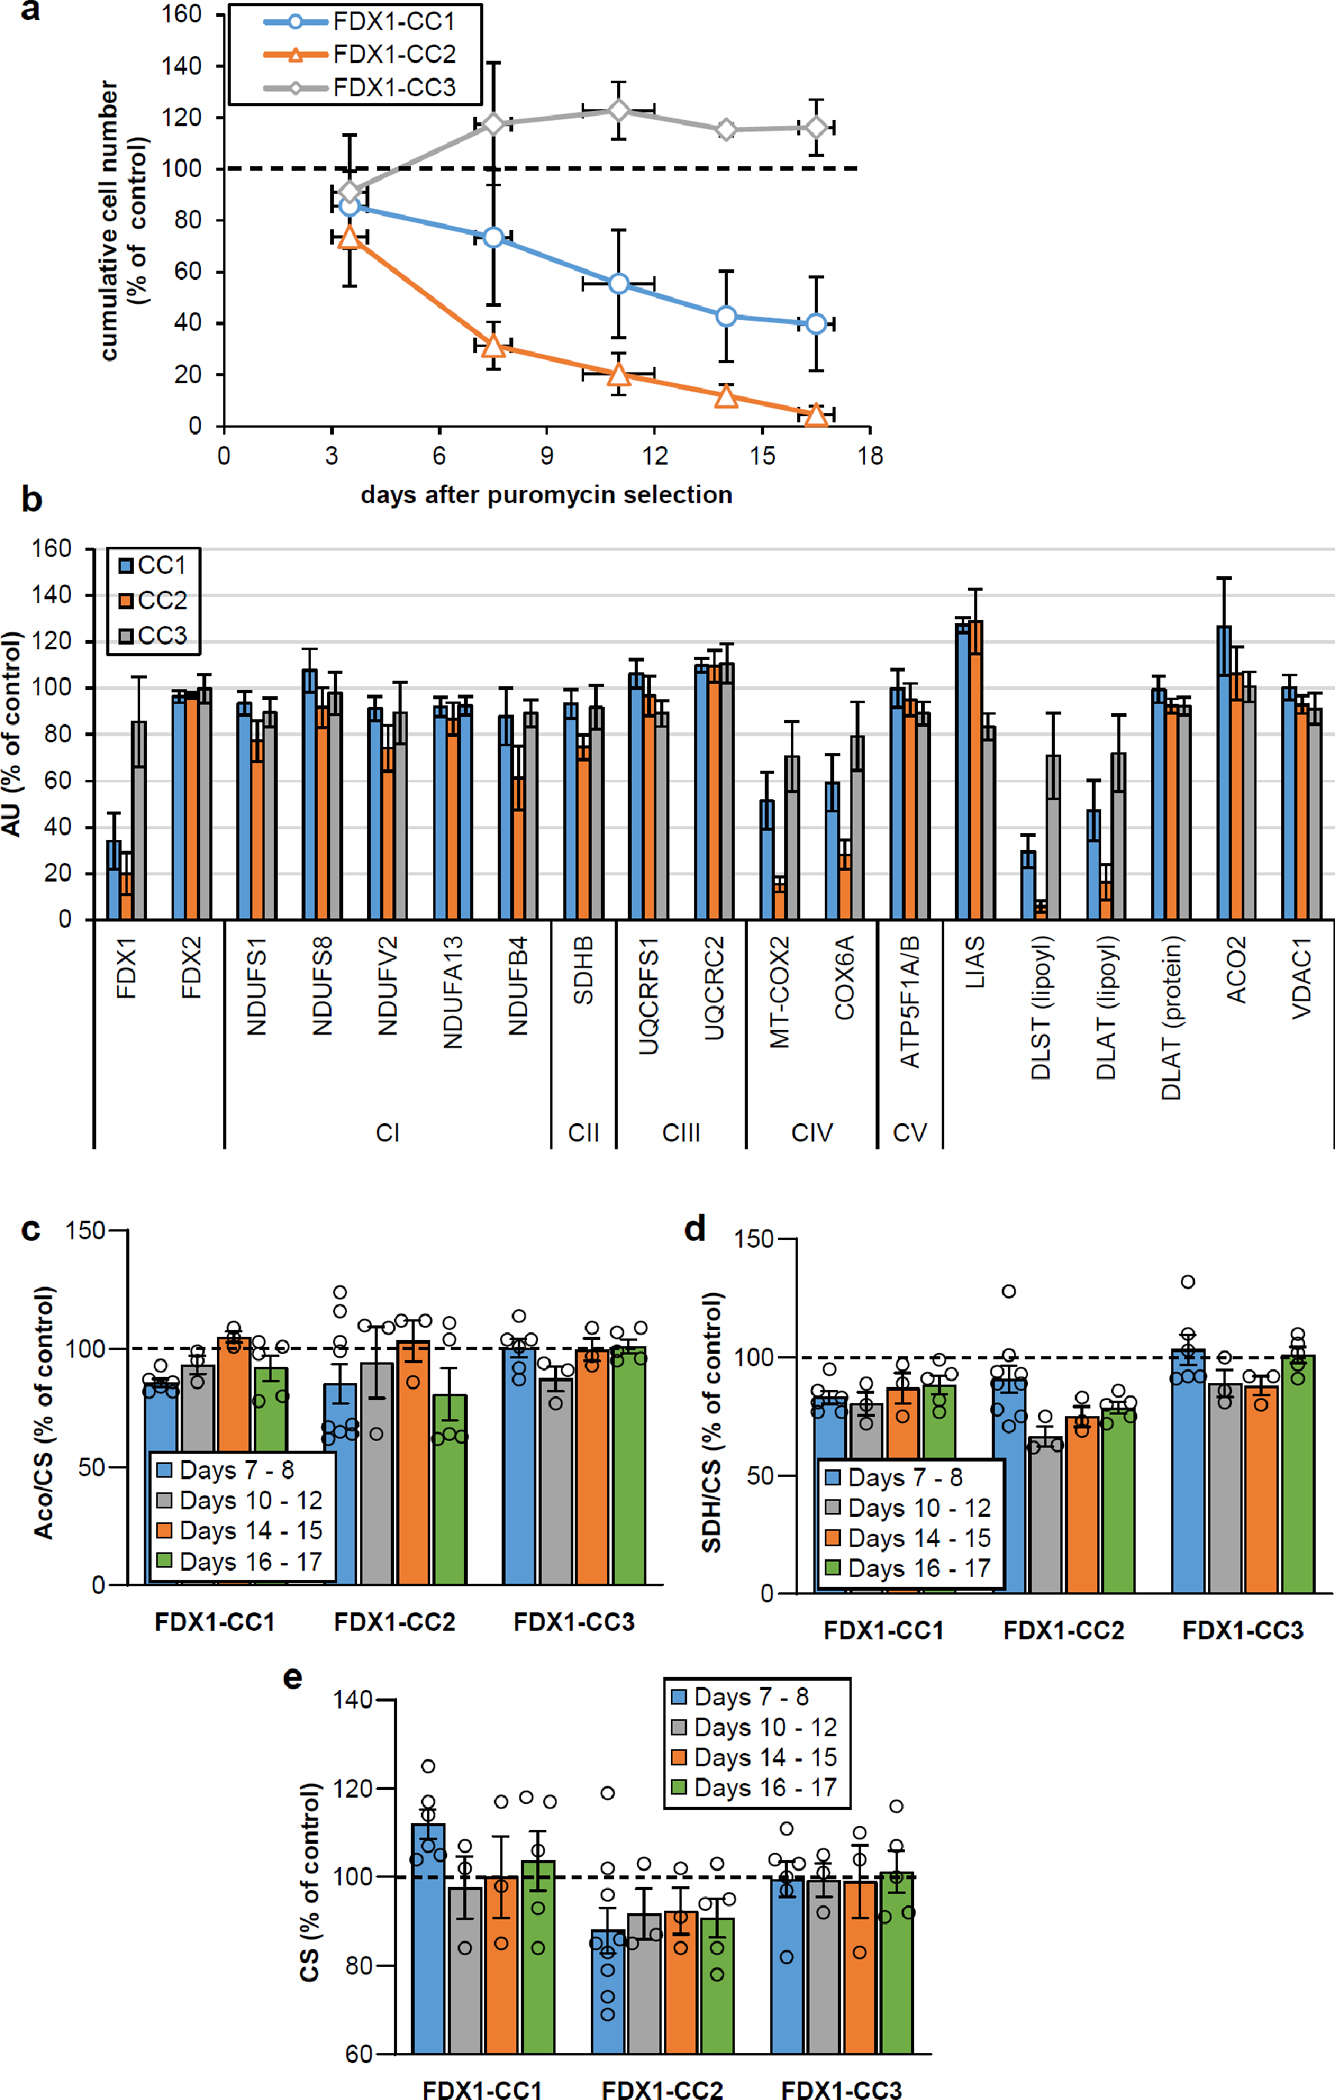
Extended data Figure 1 |. Growth phenotypes and mitochondrial Fe/S protein status of FDX1 knockout cells.

a HEK293 cell lines were subjected to CRISPR-Cas9 FDX1 gene knockout using CC1-CC3 guide RNAs. Cumulative growth of cells treated as in Fig. 1b was calculated from cell counts at various harvesting time points after puromycin removal. In detail, individual cell lines were sub-cultured by harvesting an entire culture vessel and subsequent re-seeding of a defined cell number into a new culture device. Remaining cells were collected, and the total protein content of this sample was determined. This protein amount was then used as a denominator for the calculation of the specific (i.e. total protein-related) enzymes activities measured in the respective sample. This tissue culture regime involving the re-seeding of aliquots of harvested cells produced sufficient cell material to conduct multiple analyses, even in case of an experimentally elicited growth retardation. Based on the cell counting performed at each harvest, the cumulative growth was calculated for each cell line from the total cell yield as well as the portion of cells needed for re-seeding during sub-culturing. Values are presented relative to those of control cells (set to 100%, dashed line; n ≥ 4; mean ± SEM). b Densitometric quantification of immunostains from cells treated as in Fig. 1b, 2a, and 3a (i.e. harvested 7 or 8 days after puromycin removal) using Image studio lite 5.2. Error bars indicate SEM (n ≥ 4). c-e Total aconitase (Aco), succinate dehydrogenase (SDH) and citrate synthase (CS) activities were determined in cell samples obtained at the indicated time points after puromycin removal as in Fig. 1c. Values were presented relative to those of control cells (set to 100%, dashed line; n ≥ 3; mean ± SEM).
