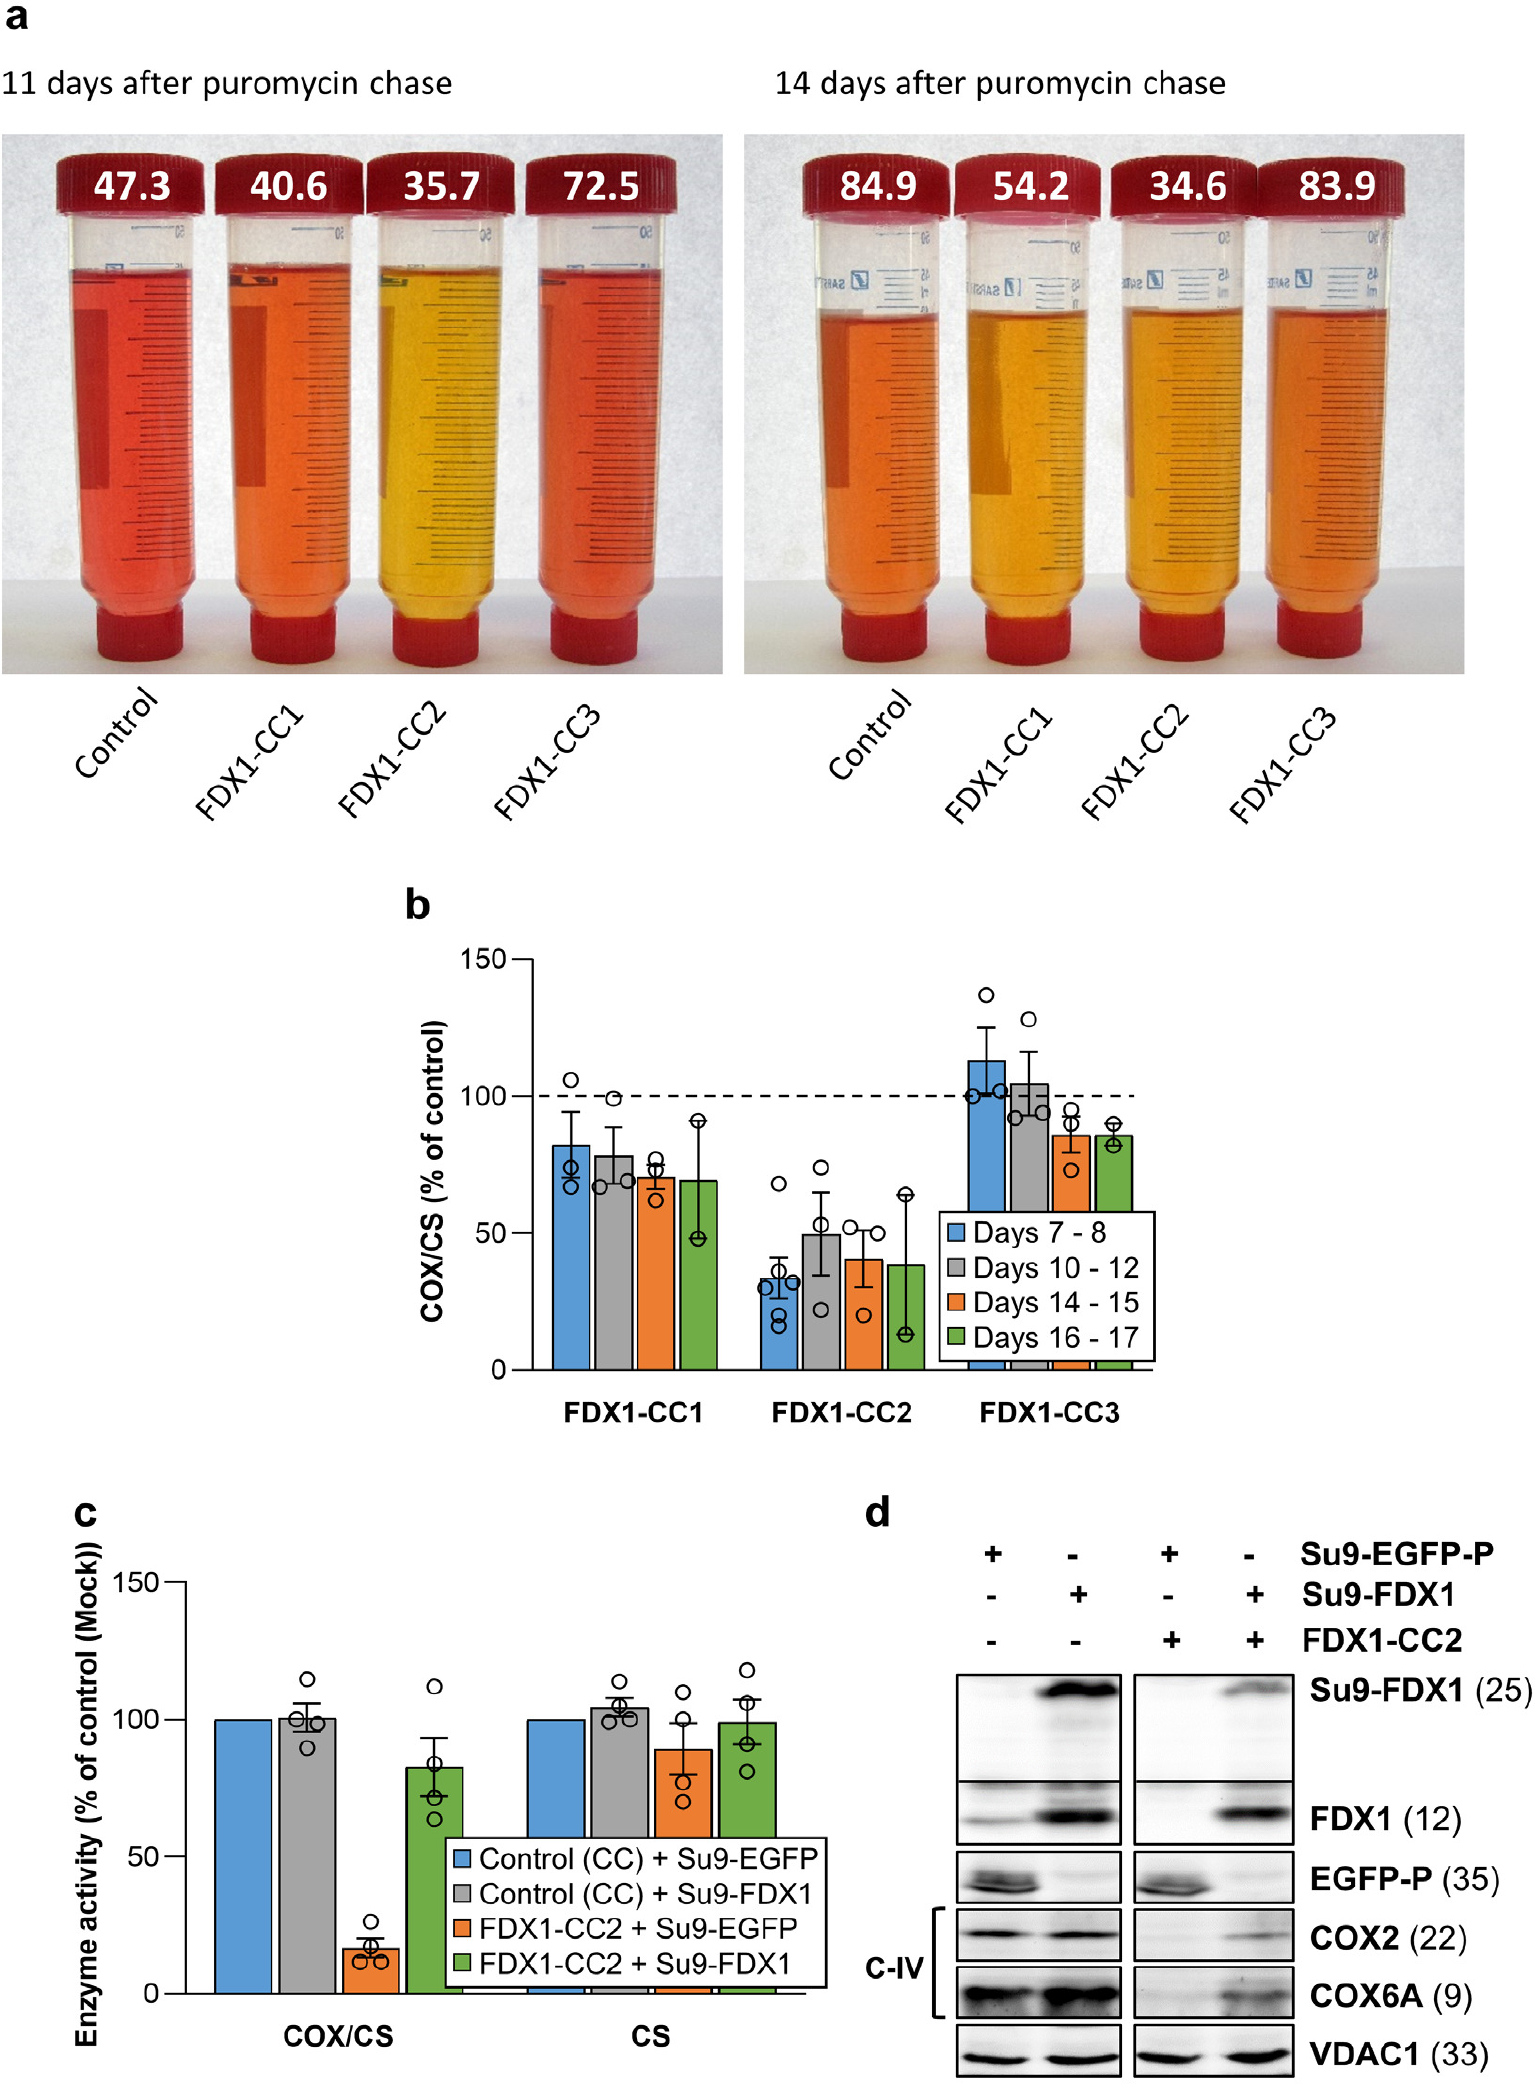
Extended data Figure 3 |. FDX1 knockout cells are deficient in cytochrome oxidase activity.

a Tissue culture media of HEK293 control and FDX1 knockout cells (cf. Figs. 2a and Extended data Fig. 1a) were collected at the indicated time points. Cells were harvested, counted, and processed as required. The color change of the pH indicator phenol red in the culture medium from reddish toward yellowish, particularly for FDX1-CC1 and -CC2 knockout cells, revealed a pH drop despite lower cell numbers in these cultures (given at the top; in millions). b Cytochrome c oxidase (COX) activities were determined in total membrane fractions from cells harvested at the indicated time points after puromycin removal (cf. Fig. 2b). COX activities were expressed relative to citrate synthase (CS) activities (Extended data Fig. 1e), and values are presented relative to those of control cells (set to 100%, dashed line; n ≥ 3; mean ± SEM). c HEK293 cells (see Fig. 2f) were chemically transfected with control plasmid PX459 or the PX459-derived plasmid FDX1-CC2 and selected by puromycin for 3 days as in Fig. 2a. 10 to 15 days after selection cells were transiently transfected by electroporation with plasmids coding for either a PEST-destabilized EGFP or FDX1, each fused to the N-terminal mitochondrial Su9 targeting sequence (from Neurospora crassa subunit 9 of mitochondrial F1Fo ATP synthase). Three days after transfection cells were harvested and analyzed for COX and CS activities. Data are presented relative to the values for Su9-EGFP control cells (n = 4; SEM). d Cell samples from (c) were subjected to immunostaining against the indicated proteins. Observed molecular masses (kDa) for proteins are given in parentheses. Representative blots are shown.
