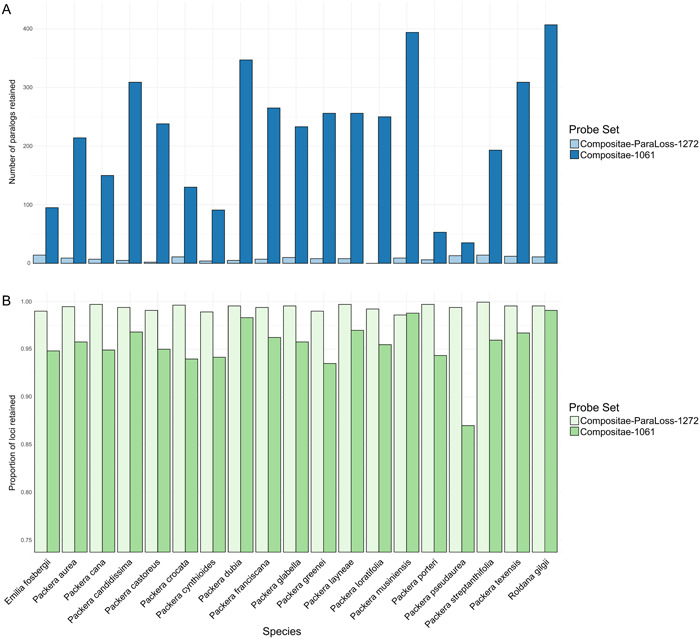
Figure 2.

Barplots showing (A) the number of flagged paralogs and (B) the proportion of loci retained for each species depending on the probe set used. Lighter colors represent the Compositae‐ParaLoss‐1272 probe set, while darker colors represent the Compositae‐1061 probe set as indicated by the keys to the right of the plots. Barplots were generated using base R.
