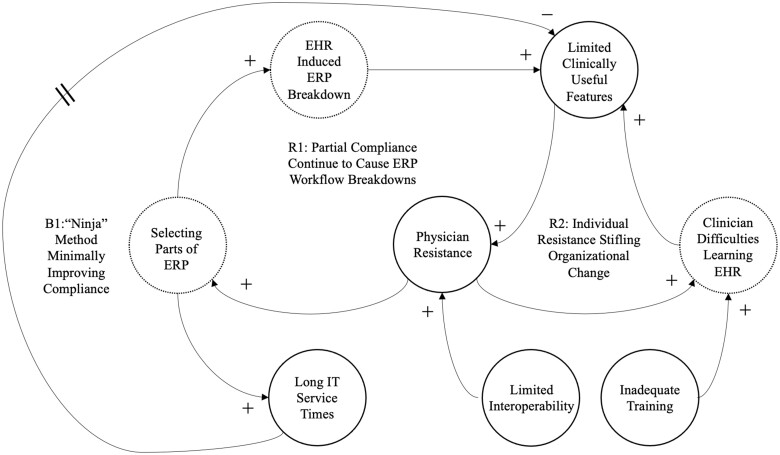
Figure 3.
Strivers’ causal loop diagram. Key feedback loops for Strivers portraying how qualitative themes under EHR Difficulties (solid-lined circles), EHR Enablers (dashed-lined circles), and EHR Barriers (dotted-lined circles) affected ERP implementation success. “B” describes balancing loops that include both + and − arrows. “R” describes reinforcing loops that only include + arrows. Arrows with a + sign indicate variables that increase or decrease together. Arrows with a − sign indicate variable relationships where increase (decrease) in one means decrease (increase) in another. A hashed line on an arrow indicates a delay in effect.

