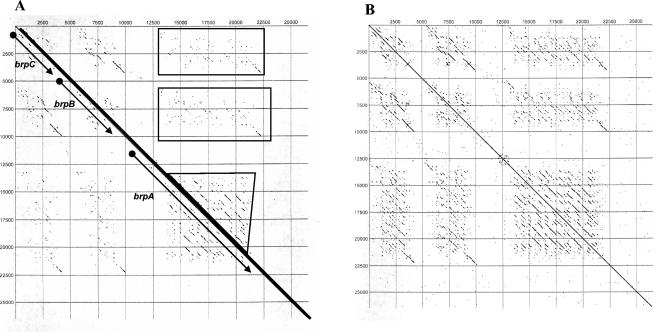
FIG. 4.
Dot plot matrix analysis at the nucleotide level of the 26-kb Bva-Brp insert plotted against itself. (A) Analysis performed at an 80% homology level. Each line represents an area with a corresponding homologous area with an identity level of at least 80%. The bold diagonal in the center represents the 100% match of the sequence with itself. Areas illustrating the locations of brpA, brpB, and brpC are denoted along the diagonal. The boxed regions of the matrix indicate homologous segments to brpA within brpA, brpB, and brpC. (B) Same as panel A, except the analysis was performed at the 70% identity level, which illustrates the areas of homology within and among the genes more clearly. Numbers on the x and y axes denote the nucleotide positions of the 26-kb Bva-Brp cloned insert.

