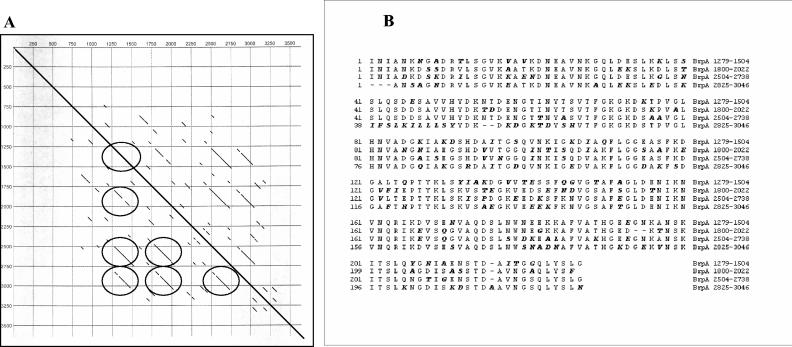
FIG. 5.
(A) Dot plot analysis at the amino acid level of BrpA plotted against itself at the 70% identity level. The diagonal in the center indicates the 100% match of the sequence with itself. Circles surround the largest repeated regions corresponding to amino acid positions 1279 to 1504, 1800 to 2022, 2504 to 2738, and 2825 to 3046. Numbers on the x and y axes denote the amino acid positions for BrpA. (B) Amino acid alignment of repeats 1279 to 1504, 1800 to 2022, 2504 to 2738, and 2825 to 3046. Residues in bold italics represent divergence from the consensus.

