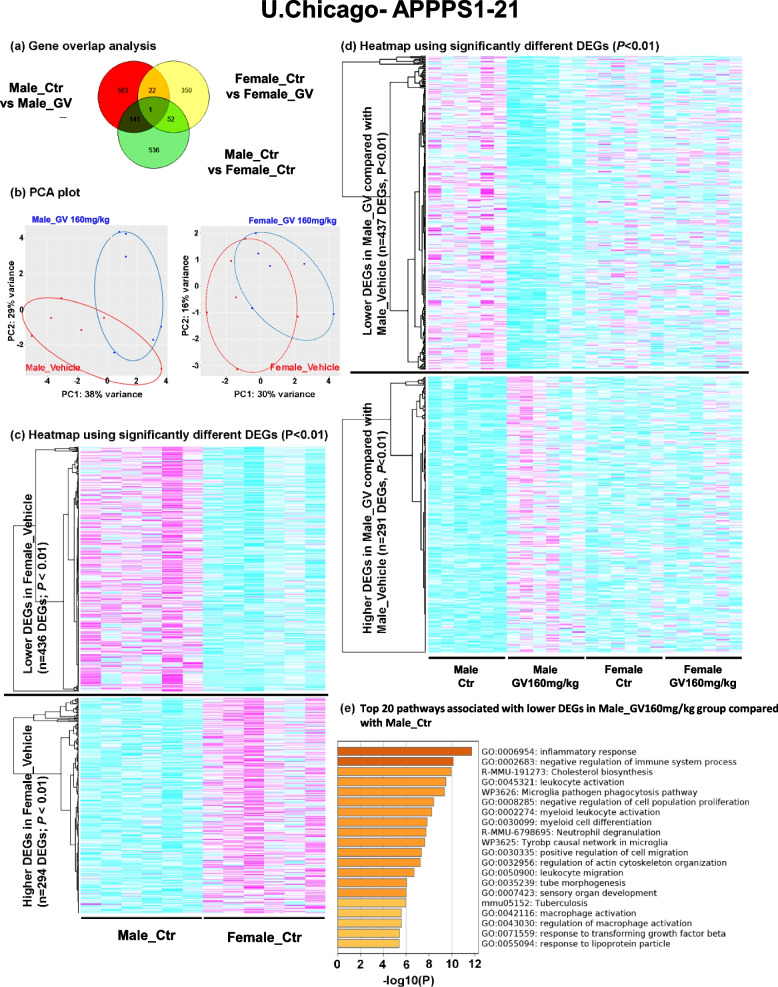
Fig. 7.
GV-971 treatment alters cerebral cortex transcriptome profiles in a sex-specific manner. a Gene overlap analysis demonstrating significant (P < 0.01) DEGs n = 728 in Male_Vehicle vs Male_GV, n = 426 DEGs in Female_Vehicle vs Female_GV and n = 730 DEGs in Male_Vehicle vs Female_Vehicle groups. Note only n = 23 DEGs that were common between GV-971-treated male and female groups compared with their respective vehicle-treated controls. b PCA plot. c Heatmap associated with lower DEGs (n = 436, P < 0.01) and higher DEGs (n = 294, P < 0.01) in Vehicle-treated female group compared with Vehicle-treated male group, note the sex-specific differences in DEGs between control male and female groups. Each column in an individual animal, n = 6 mice per group. d Heatmap associated with lower DEGs (n = 437, P < 0.01) and higher DEGs (n = 291, P < 0.01) in GV-971 treated male group compared with Vehicle-treated male group. Notice the female group columns exhibited no apparent differences for these genes. Each column is an individual animal, n = 6 mice per group. e GO biological processes, molecular functions, and KEGG pathways analysis based on the DEGs (P < 0.01) between vehicle-treated male and GV-971-treated male groups. Panel shows heatmap of top 20 pathways associated with lower DEGs in GV-971-treated male group compared with control

