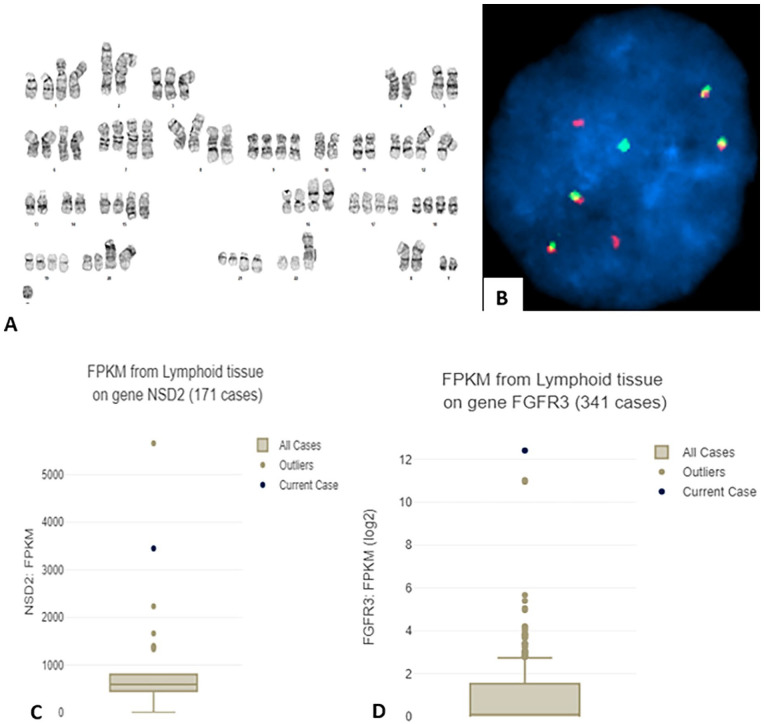
Figure 1.
(A) G-banded karyotype of leukemia cells in BM; see text for complete description of the karyotype. (B) FISH with FGFR3 (red) and IGH (green) probes showing FGFR3::IGH (4 copies). (C and D) Box and whisker plots showing RNA expression of NSD2 (C) and of FGFR3 (D) using fragments per kilobase millions (FPKM) compared to other clinical cases of the same tissue type according to the corresponding Oncotree root (JCO Clin Cancer Inform 2021;5:221-230).

