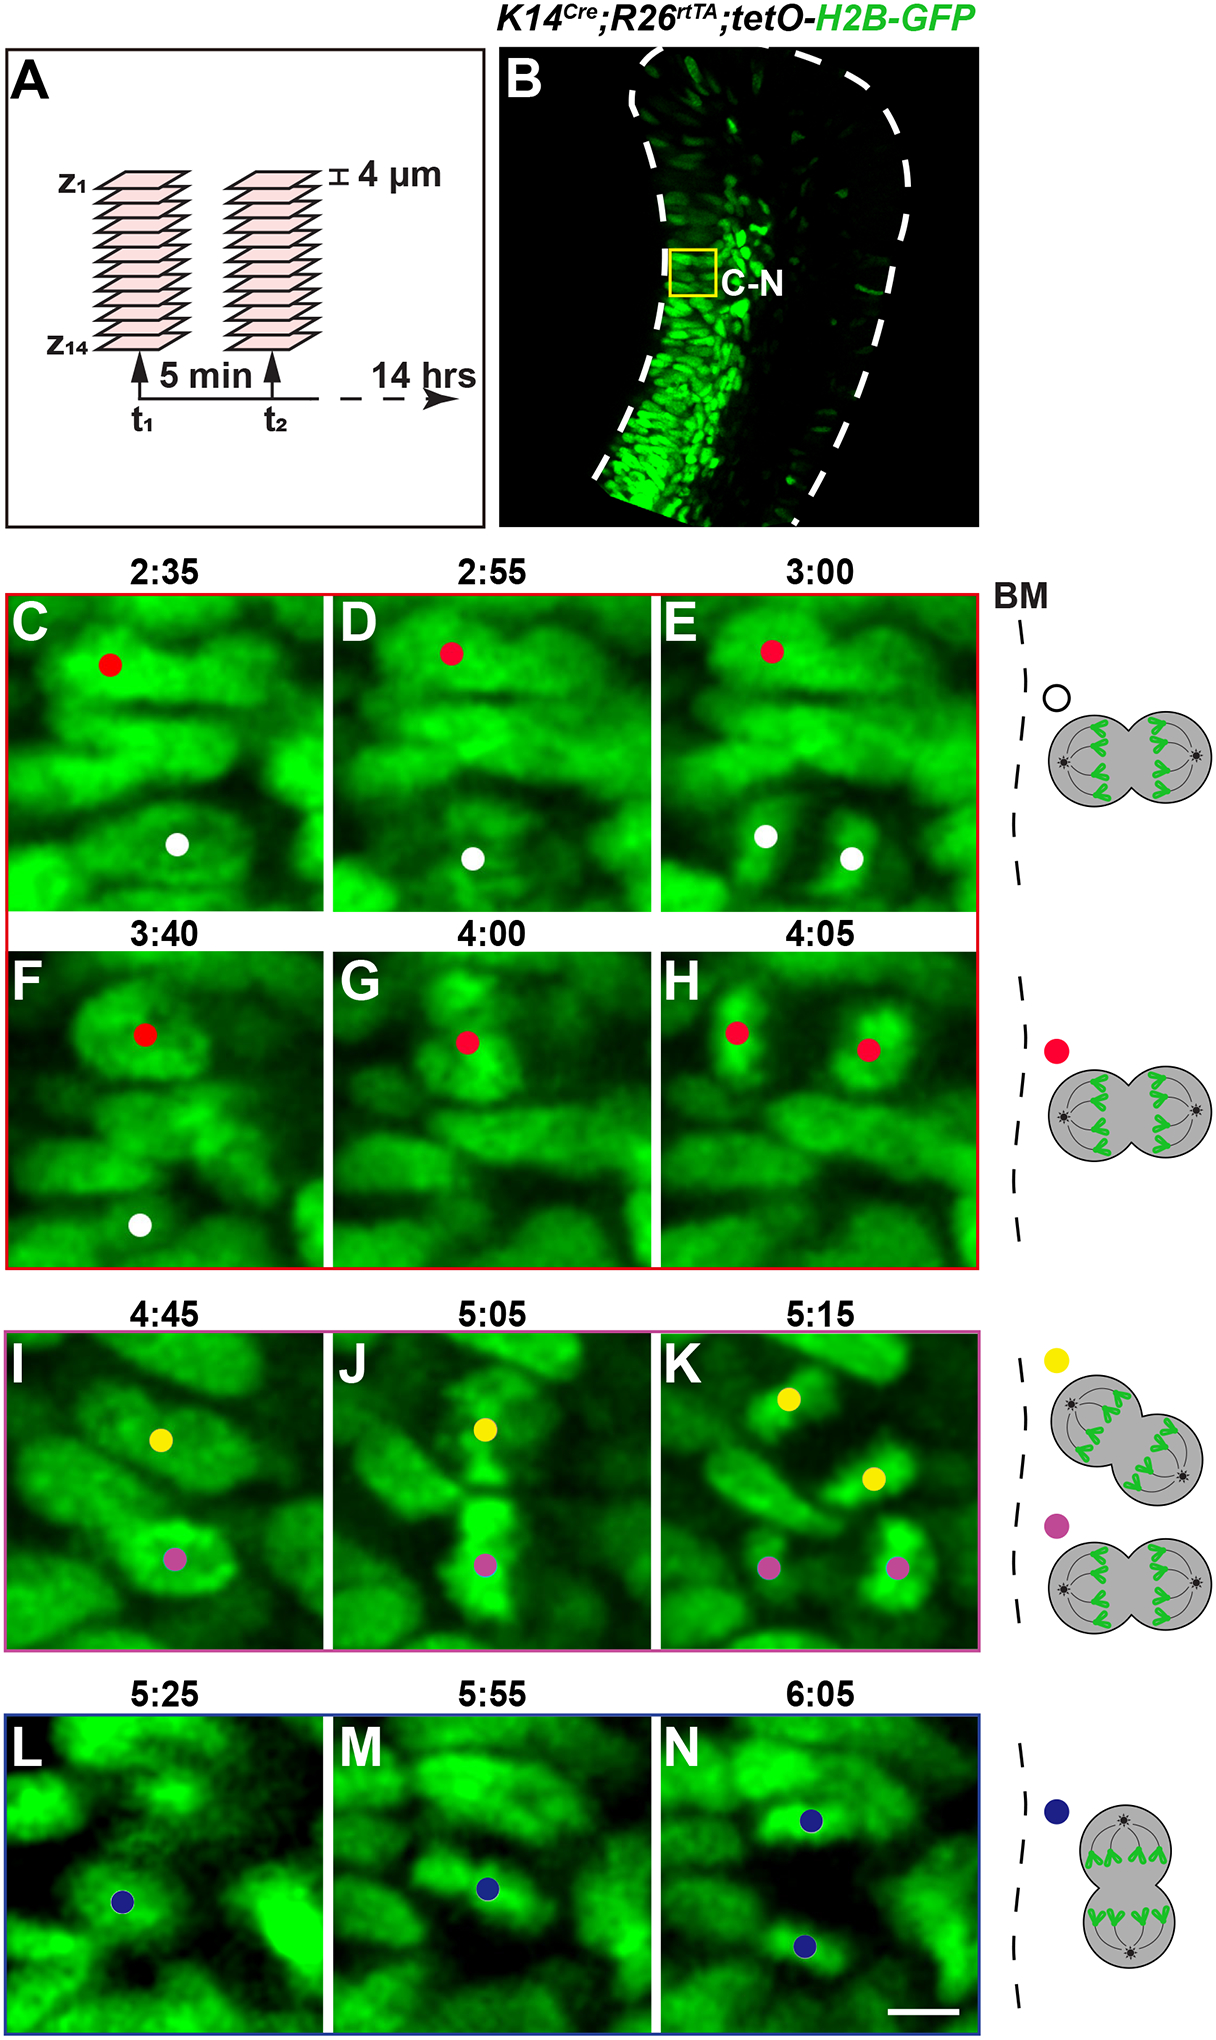
Figure 5: Timelapse microscopy of the K14Cre;R26rtTA;tetO-H2B-GFP cervical loop.

(A) A schematic illustrating the timelapse setup. (B) A representative z-plane of the K14Cre;R26rtTA;tetO-H2B-GFP incisor labial cervical loop, showing nuclear labelling by H2B-GFP primarily in the transit-amplifying region, where cells actively divide. Yellow box represents the general area of the enlarged images shown below. (C–K) Timelapse images showing vertical and oblique cell divisions relative to the BM. (L–N) Timelapse images showing an example of horizontal cell division relative to the BM. (D,G,J,M) Cells in metaphase or anaphase are displayed in the middle panels. Schematics of each tracked division are shown on the right. Scale bar in N = 36 μm (B); 5 μm (C–N). Abbreviation: BM = basement membrane.
