Figure 6:

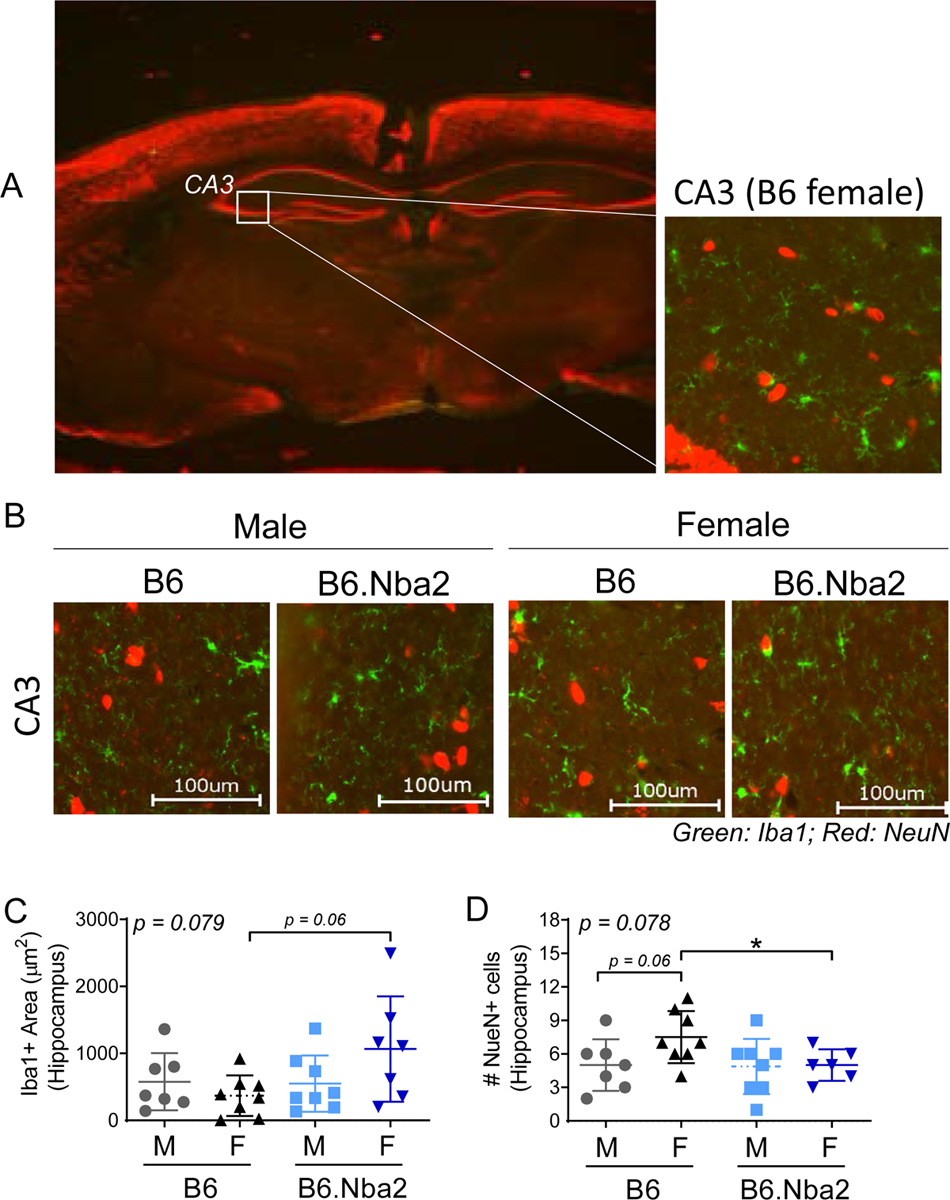
B6.Nba2 females show decreased numbers of hippocampal NeuN+ cells. A) Representative images of the hippocampal region at 2X (left) and 40X (right), stained for Iba1 (green) and NeuN (red), are shown for overall brain tissue orientation. B) Representative images of the CA3 region from male and female, B6 and B6.Nba2 mice (40X). C-D) The total area (μm2) of hippocampal Iba1+ staining was quantified (C), and the total numbers of NeuN+ cells were counted (D) from three separate 200μm × 200μm hippocampal regions from each mouse. Each symbol represents one animal. Mean +/− SEM is given by horizontal lines and error bars. One-way ANOVA result is provided in the upper left corner of each graph. * p < 0.05, Student’s unpaired t-test with Welch’s correction.
