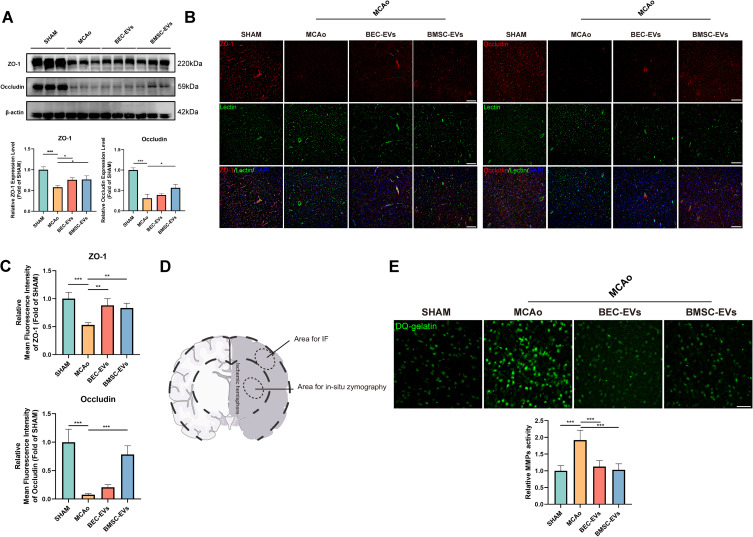
Figure 5.
BEC-EVs and BMSC-EVs administrations enhanced TJ proteins and restrained MMPs activity in MCAo rats. (A) Western blotting and relative quantification of ZO-1 and Occludin in brain microvessels after EVs treatment groups (n=3). (B) Immunofluorescence staining of ZO-1 and Occludin in ischemic brain cortex. Scale bar: 200 µm. (C) Relative quantification of mean fluorescence intensity of ZO-1 and Occludin (n=4). (D) Schematic diagram of Immunofluorescence observation area and In-situ zymography zone. (E) MMPs activity detection and quantitative analysis (n=4). Scale bar: 50 µm ***P < 0.001, **P < 0.01, *P < 0.05.

