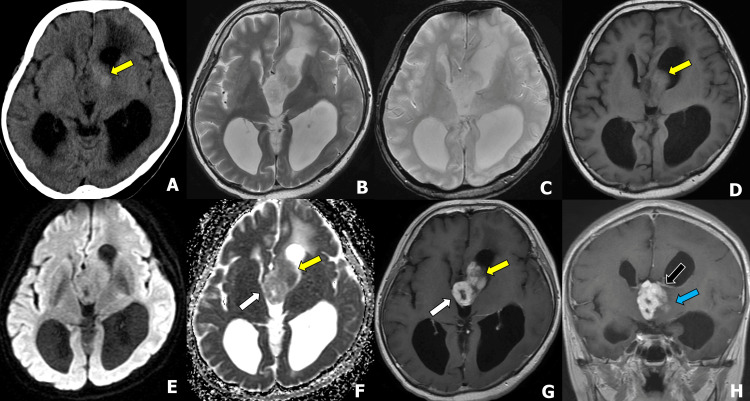
Figure 2. Preoperative CT and MRI one month after the initial visit.
(A) Axial computed tomography (CT), (B) T2-weighted image (T2WI), (C) T2*WI, (D) T1WI, (E)diffusion-weighted image (DWI), (F) apparent diffusion coefficient (ADC) map, (G) axial postcontrast T1WI, and (H) coronal postcontrast T1WI.
The tumor consisted of two following components: the ventral component appeared dense on CT, slightly hyperintense on T1WI, demonstrated contrast enhancement on postcontrast T1WI, and had a decreased ADC value (F; yellow arrow). The dorsal component showed ring enhancement on postcontrast T1WI and an increased ADC value in the solid component (E and F; white arrows). In DWI, both components showed signals close to the cerebral white matter, and no marked high signals were observed. No hemorrhage or calcification was observed on T2*WI (C). The tumor predominantly occupies the third ventricle and left Moro foramen, located beneath the thalamostriate vein (H; black arrow), and appears contiguous with the brain parenchyma (H; blue arrow).

