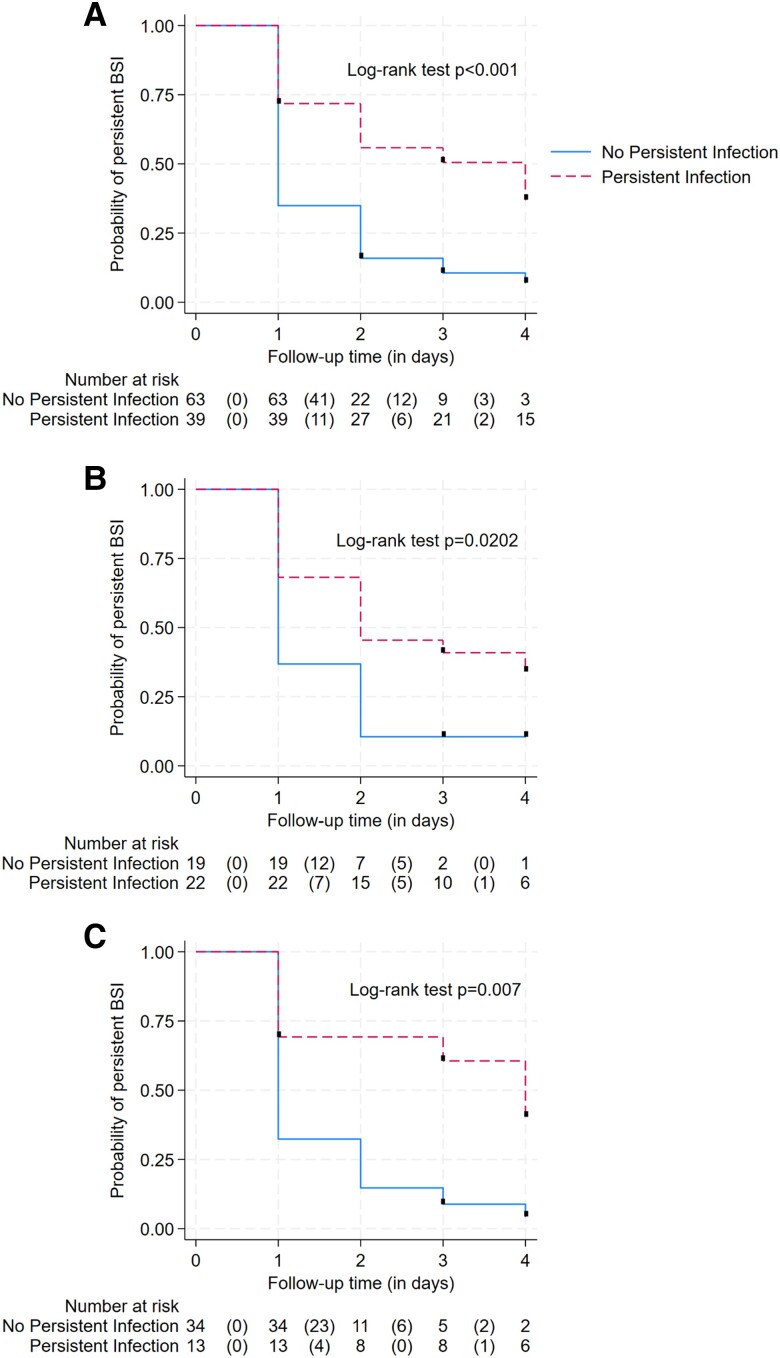
Figure 3.
Kaplan-Meier curves showing time to MR-DNAemia clearance according to persistent, clinically determined infection in the overall population (log-rank test, P < .001) (A) and in patients with Staphylococcus aureus (log-rank test, P = .02) (B) and gram-negative BSI (log-rank test, P = .007) (C). Abbreviations: BSI, bloodstream infection; MR-DNAemia, magnetic resonance–DNAemia

