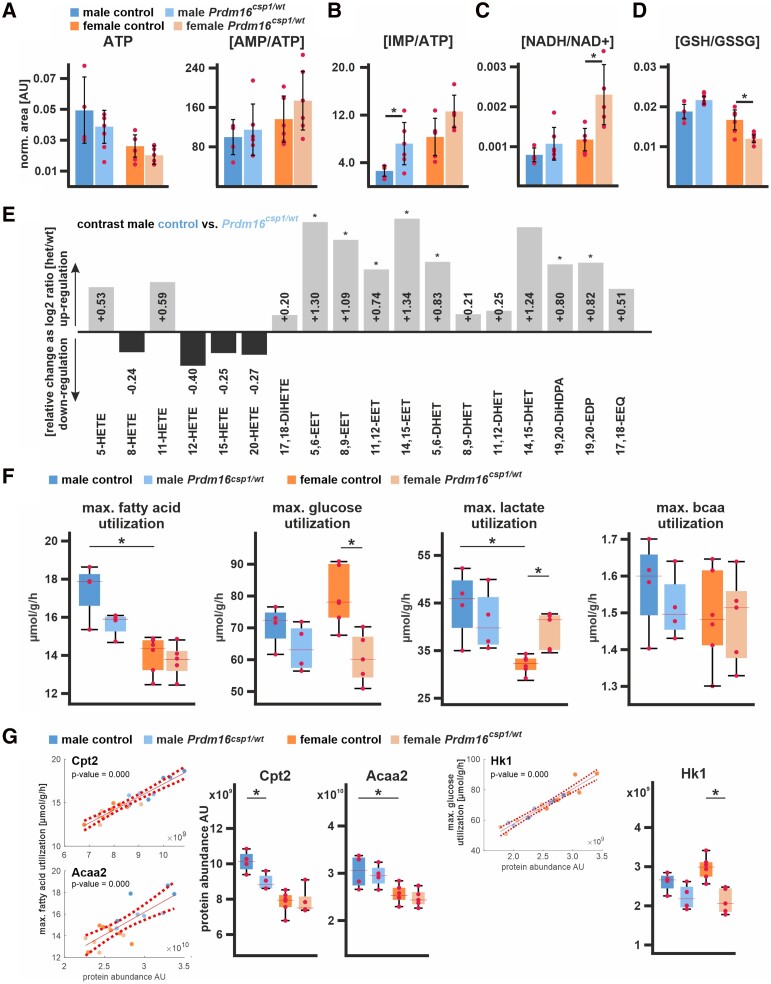
Figure 6.
Nutrient metabolism in Prdm16csp1/wt cardiac tissue. (A) Assessment of metabolites critical for energy metabolism using LV tissue and LC-MS. Normalized values are shown for adenosine triphosphate (ATP) and the ratio of adenosine monophosphate (AMP) vs. ATP (AMP/ATP). Analysed biological replicates are n = 4–6 for A to D. (B) The ratio of inosine monophosphate (IMP) vs. ATP (IMP/ATP) is increased in Prdm16csp1/wt hearts. (C) The ratio of reduced vs. oxidized nicotinamide adenine dinucleotide (NADH/NAD+) is increased in female Prdm16csp1/wt hearts. (D) Oxidative capacity of cardiac tissues was assessed with the ratio of reduced vs. oxidized glutathione (GSH/GSSG). Female Prdm16csp1/wt hearts show a significantly reduced GSH/GSSG ratio. (E) Eicosanoids were measured in male Prdm16csp1/wt hearts with LC/ESI-MS-MS. Data are presented as log2 Prdm16csp1/wt/controls ratio with down- or up-regulation as black or grey bars, respectively. All epoxyeicosatrienoic (EET) and dihydroxyeicosatrienoic (DHET) acids are increased in Prdm16csp1/wt cardiac tissue. Corresponding absolute measurements are available in Supplementary material online, Table SVIII in the Data Supplement. Analysed biological replicates are n > 6. (F) Modelling of major cardiac metabolic processes occurred with CARDIOKIN126 using protein expression data. Differences in maximal substrate utilization for fatty acids (FA), glucose, lactate, and branched chain amino acids (bcaa). Box plots show median and 25% quartile. Dots depict maximal capacities for individual animals. (G) Individual protein impact for FA and glucose metabolism was correlated for carnitine palmitoyltransferase 2 (Cpt2), acetyl-CoA acyltransferase 2 (Acaa2), and hexokinase 1 (Hk1) using linear regression analysis of the maximal substrate utilization vs. protein abundance (dashed lines indicate confidence interval, 95%). Box plots show median and 25% quartile. Dots depict Cpt2, Acaa2, and Hk1 maximal capacities for individual animals. Statistical analysis of individual metabolites and processes was performed with unpaired t-test, * indicates P < 0.05. Analysed biological replicates are n = 4–6.

