FIG. 4.
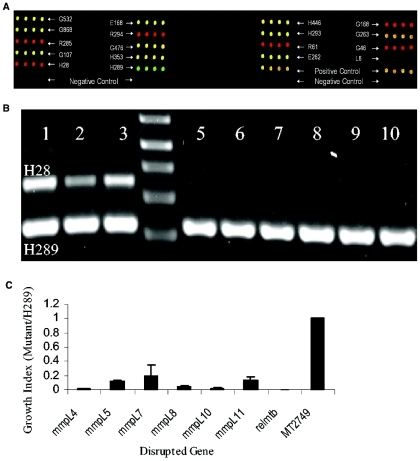
(A) Microarray with input probes labeled with Cy5 (red) and output probes labeled with Cy3 (green) that were prepared by using colonies obtained from the lungs of mice. Each oligonucleotide represents a junction sequence for a mutant and is printed four times. The mutants that were underrepresented in the output pool (attenuated for in vivo survival) have proportionately more Cy5 probe and produce red spots on the array. There are four controls on this array: (i) H28 is a mutant from a different pool, pool A, that was observed to be attenuated and was used in this pool as a control; (ii) H289 is another mutant from pool A that was not attenuated; (iii) spots labeled as positive controls contain a mixture of all of the oligonucleotides printed on the arrays and thus is an internal positive control; and (iv) spots labeled as negative controls are oligonucleotides representing four different mutants from a different pool and thus serve as internal controls for background noise. (B) Agarose gel electrophoresis showing PCR amplicons of junctions of H28 and H289 (control). Lanes 1, 2, and 3 represent mutants recovered from lungs of three mice sacrificed at 1 day postinfection (input pool). Similarly, lanes 5, 6 and 7, and 8, 9, and 10 represent mutants recovered from three mice sacrificed at 49 and 98 days postinfection, respectively. Lane 4 is 1-kb plus marker (Invitrogen). (C) Six mmpL mutants and a control, H28, are compared against H289 for growth in vivo. Mutants H28 and H289 were used as controls based on their phenotypes from an earlier experiment. H28 is one of the 100 mutants of pool A and was observed to be attenuated. H289 is another mutant from pool A that was not attenuated for growth in vivo. Growth index refers to the population of each mutant, as measured from signals from the DeADMAn arrays, in the lungs of mice relative to the population of the positive control strain H289. The errors bars represent the standard deviation.

