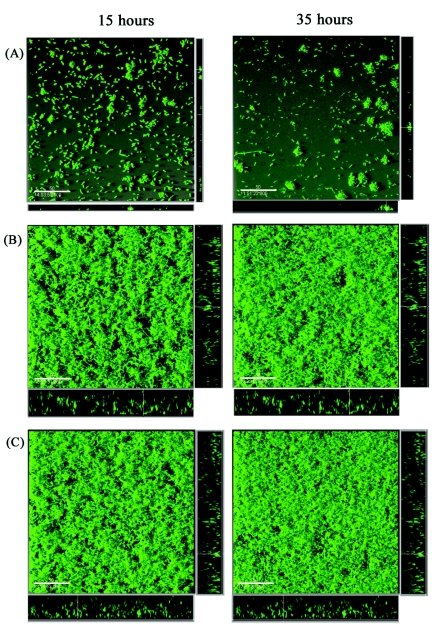
FIG. 7.
Spatial distribution of biofilm formation for gfp-labeled E. coli MS427 derivative strains. (A) pACYC184 (vector control) (strain OS70). (B) pRMV4b (TibCA+) (strain OS136). (C) pRMV1 (TibA+) (strain RMV3). Biofilm development was monitored by SCLM at 15 h (left images) and 35 h (right images) after inoculation. The images are three-dimensional projections collected for the biofilms and vertical sections (to the right and below for each individual panel) representing the yz plane and the xz plane, respectively, at the positions indicated by the white lines. Scale bars = 50 μm.

