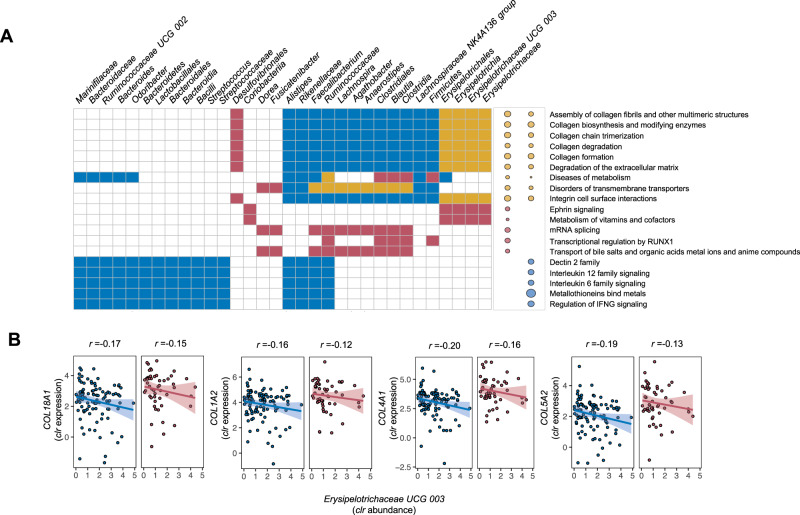
Fig. 4. Mucosal host–microbe interaction modules in the context of IBD.
Sparse canonical correlation analysis (sparse-CCA) was performed across inflamed and non-inflamed biopsies to identify distinct correlation modules of mucosal gene expression vs. mucosal microbiota. Using 1441 inflammation-related genes and 131 microbial taxa as input, we identified seven distinct pairs of significantly correlated gene-microbe components in non-inflamed tissue and six distinct pairs in inflamed tissue (adjusted P < 0.05). A Heatmap showing significant component pairs from sparse-CCA analysis consisting of microbial taxa (horizontal axis) and host pathways (vertical axis) to which the involved genes were annotated (Spearman correlation, adjusted P < 0.05). Yellow boxes and dots indicate shared significant component pairs between inflamed and non-inflamed tissues, red colors indicate significant component pairs only in inflamed tissues, blue colors indicate significant component pairs only in non-inflamed tissues, and white colors indicate the absence of significant correlations. Dot sizes represent the degree of statistical significance of correlated component pairs. B Examples of inverse correlations existing between key genes involved in collagen and ECM biosynthesis (COL18A1, COL1A2, COL4A1, and COL5A2) and the mucosal abundance of Erysipelotrichaceae UCG 003 taxon, representing the significant component pairs observed in both inflamed and non-inflamed tissues as visualized in the right upper corner of panel A. The shaded areas represent the 95% confidence intervals for predictions from a linear model. Source data are provided as a Source Data file.

