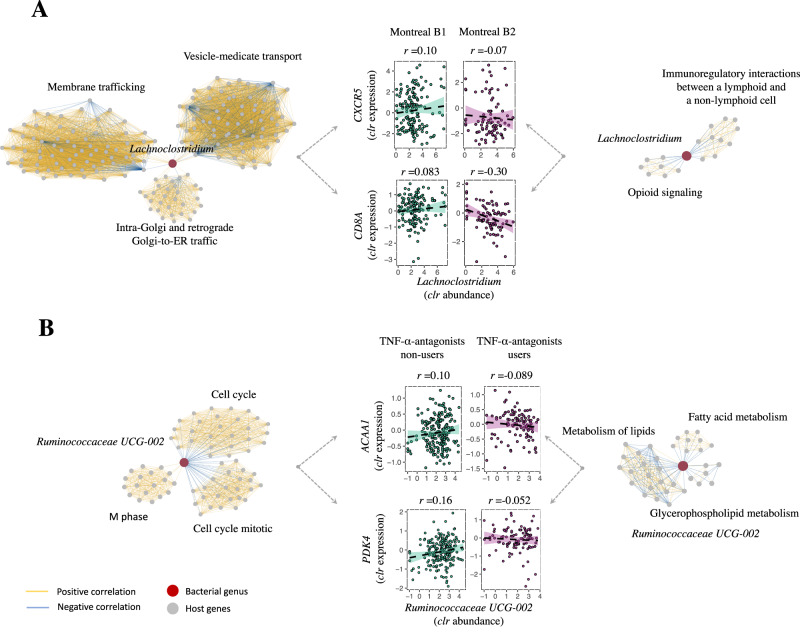
Fig. 5. Fibrostenotic CD and TNF-α-antagonist usage significantly alter mucosal host–microbe interactions in the context of IBD.
CentrLCC-network analyses were performed to characterize altered mucosal host–microbe interactions between different patient phenotypes. Overall, fibrostenotic CD (Montreal B2 vs. non-stricturing, non-penetrating CD, i.e. Montreal B1) and use of TNF-α-antagonists (vs. non-users) demonstrated altered interaction networks. A Network graphs showing an example of Lachnoclostridium-associated gene clusters in patients with non-stricturing, non-penetrating CD (Montreal B1) (left) and patients with fibrostenotic CD (Montreal B2) (right). Lachnoclostridium was the top bacteria involved (covering 65% of total associations in non-stricturing, non-penetrating CD and decreasing to 27% in fibrostenotic CD). Red dots indicate mucosal microbiota. Gray dots indicate the genes annotated by Reactome pathways. Yellow lines indicate positive associations between gene expression and bacterial abundances. Blue lines indicate negative associations. Middle panel shows key examples that significantly altered in the two patient groups, including genes involved in immunoregulatory interactions between lymphoid and non-lymphoid cells and tyrosine kinase signaling (CD8A and CXCR5). Correlations were prioritized on statistical significance. B Network graphs showing the example of microbiota–gene interaction networks in patients not using TNF-α-antagonists (left) vs. patients using TNF-α-antagonists (right). Ruminococcaceae UCG_002 was altered in interactions with host genes in patients using TNF-α-antagonists. Middle panel shows key examples of Ruminococcaceae UCG_002–gene interactions. These genes were involved in general biological processes such as the cell cycle but also included genes involved in fatty acid metabolism (PDK4 and ACAA1). Correlations were prioritized on statistical significance. The shaded areas represent the 95% confidence intervals for predictions from a linear model. Source data are provided as a Source Data file.

