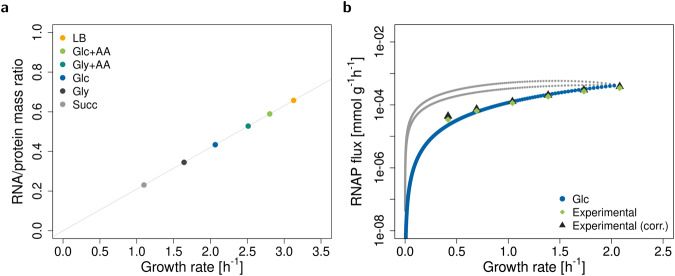
Fig. 2. Validation of the base model.
a The model predicts a linear relationship between RNA to protein ratio and growth rate. The points represent the predicted maximum growth rates in six experimental conditions (Supplementary Table 1). The line is a linear fit. b Alternative RNAP fluxes at different non-optimal growth rates in glucose minimal medium. These are obtained by varying the growth rate step by step from zero to maximum and enumerating all solutions (elementary growth vectors as defined in Müller et al.23) for each growth rate. The grey and blue lines are the alternative solutions. The blue line corresponds to solutions, where rRNA and ribosomes do not accumulate (constraints rRNA and cap R in Table 1 are limiting). Light green diamonds are experimental data from Bremer and Dennis20, black triangles are the data from Bremer and Dennis20 corrected for rRNA degradation28. Data was converted to mmol g−1 with E. coli dry masses from Bremer and Dennis20 and the number of nucleotides in rRNA (nrRNA) at xrP = 36%.

