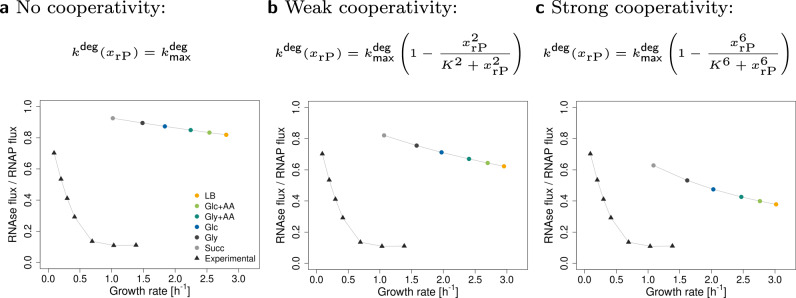
Fig. 5. Fraction of degraded rRNA at different growth rates.
The extended model recapitulates the experimentally observed decrease in the fraction of degraded RNA with increasing growth rate. The circles are the predicted ratios of RNAse fluxes to RNAP fluxes at different conditions. The triangles represent experimental data from Gausing28, extracted from the original plot with WebPlotDigitizer66. Panels (a–c) represent three types of rRNA degradation. a No cooperativity of rPs. b Weak cooperativity of rPs. c Strong cooperativity of rPs.

