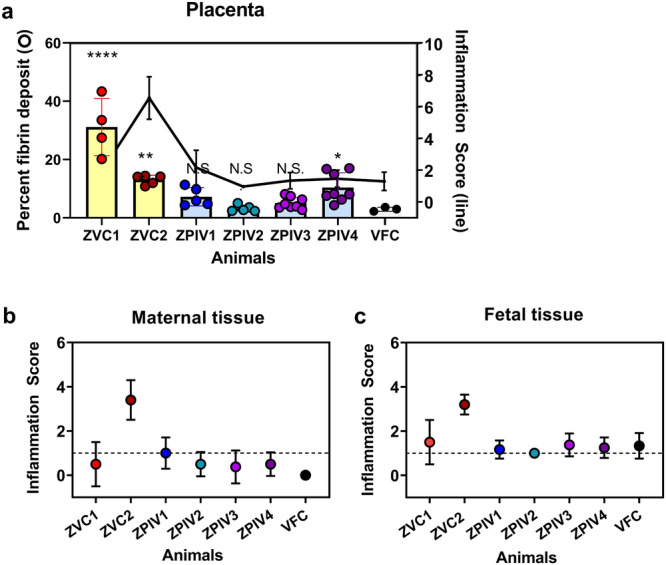
Fig. 4. Fibrin depositions and inflammation scores in the placentas.

At 14 dpi, multiple tissue blocks per placenta were stained with hematoxylin and eosin and examined. The areas of fibrin deposition were measured using HALO image analysis Platform software and presented as percent fibrin deposit (circles with bar) of the individual placentas (a). One-way ANOVA test was used to analyze the difference between virus-free control (VFC) and each of the individual animals. Asterisk indicates significant difference, ****P < 0.0001; ***P = 0.0024; *P = 0.0134; N.S., not significant (P > 0.05). A spectrum of inflammation in the placentas (black line) was assessed in a semi-quantitative method described in the materials and methods. Inflammation in the maternal tissue, decidua and intertrabecular space, (b) or fetal tissue, trabecular villi, (c) of the placentas are presented as the mean of 3–8 individual tissue blocks per placenta (±standard deviation). Dotted line represents mild inflammation score 1.
