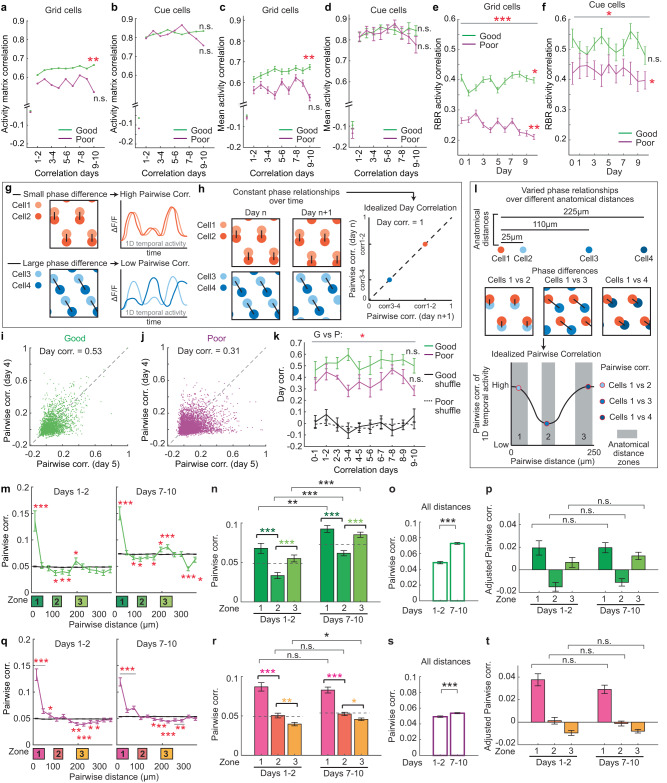
Fig. 5. Grid and cue cell activity during learning.
a–b Activity matrix correlations on adjacent days for grid (a) and cue (b) cells. c–d Correlation of mean ΔF/F as a function of track position on adjacent days for individual grid (c) and cue (d) cells. e–f RBR activity correlation of grid (e) and cue (f) cells. g Phase relationships of grid cells as represented by pairwise correlations (Pairwise corr.) of their temporal calcium activity. Small and large phase differences of grid cell pairs (left) correspond to high and low correlations of their temporal activity (right), respectively. h If pairwise phase relationships between grid cell pairs are preserved on adjacent days (left), the Pairwise corr. of these pairs on adjacent days will be perfectly correlated (Day correlation/Day corr. = 1; right). i–j Pairwise corr. of grid activity (ΔF/F) on days 4 and 5 in the good (i) and poor (j) performers. k Day corr. between adjacent days for the good performers (G), poor performers (P), and their shuffles (Good or Poor). Error bars are generated by data from individual FOVs. l The phase relationship of grid cell pairs varies with respect to their anatomical distance. Cells in close proximity (zone 1: 0–50 μm) and farther distances (zone 3: 193–245 μm) have small phase differences (top) and therefore high Pairwise corr. (bottom). Grid cells at intermediate distances (zone 2: 92–132 μm) have large phase differences (top) and therefore low Pairwise corr. (bottom). Gray regions represent the above anatomical distance zones 1–3 used for the following analysis. g, h, l For clarity, we show 2D grid cell relationships here. In this study, we use the correlation of 1D temporal activity to approximate 2D phase relationships. m, q Pairwise corr. as a function of pairwise distance for the good (m) and poor (q) performers before (days 1–2) and after (days 7–10) learning. * indicates the significant difference between real data and shuffles. n, r Pairwise corr. in the three zones before (days 1–2) and after (days 7–10) learning in good (n) and poor (r) performers. o and s Comparison of the pairwise correlations of grid cell pairs in the good (o) and poor (s) performers at all distances before and after learning. p, t Comparison of Adjusted Pairwise corr. in the three zones before and after learning in the good (p) and poor (t) performers. *p ≤ 0.05, **p ≤ 0.01, ***p ≤ 0.001. Error bars represent mean ± sem. Horizontal gray lines indicate p values for the group difference. * to the right of line graph indicates significant positive or negative correlation from day 1–2 to day 9–10 or day 1 to day 10, as appropriate. See Supplementary Data 1 for exact n and detailed statistical information. Source data are provided as a Source Data file. See also Figs. S5–S7.

