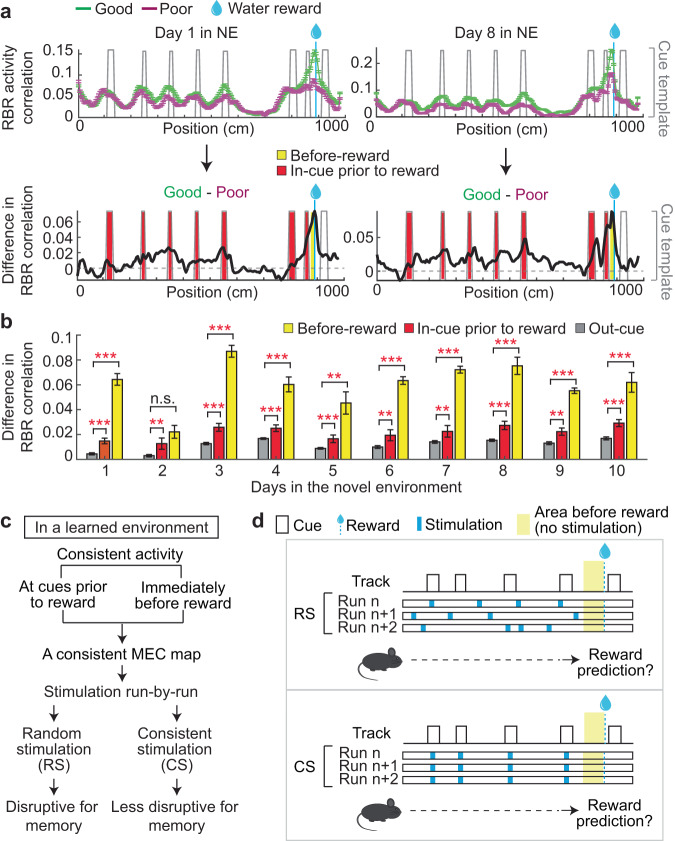
Fig. 7. Consistent MEC activity along the track.
a Top: Comparison of RBR spatial activity consistency along the track between the good and poor performers on days 1 (left) and 8 (right). Bottom: The difference between the RBR correlations of the good and poor performers. NE Novel environment, FE Familiar environment. b RBR activity correlation difference between the good and poor performers. c Hypothetical results of modulating MEC map consistency. d Strategy for optogenetics experiments. *p ≤ 0.05, **p ≤ 0.01, ***p ≤ 0.001. Error bars represent mean ± sem of all cells in the good and poor performers. See Supplementary Data 1 for exact n and detailed statistical information. Source data are provided as a Source Data file. See also Fig. S8.

