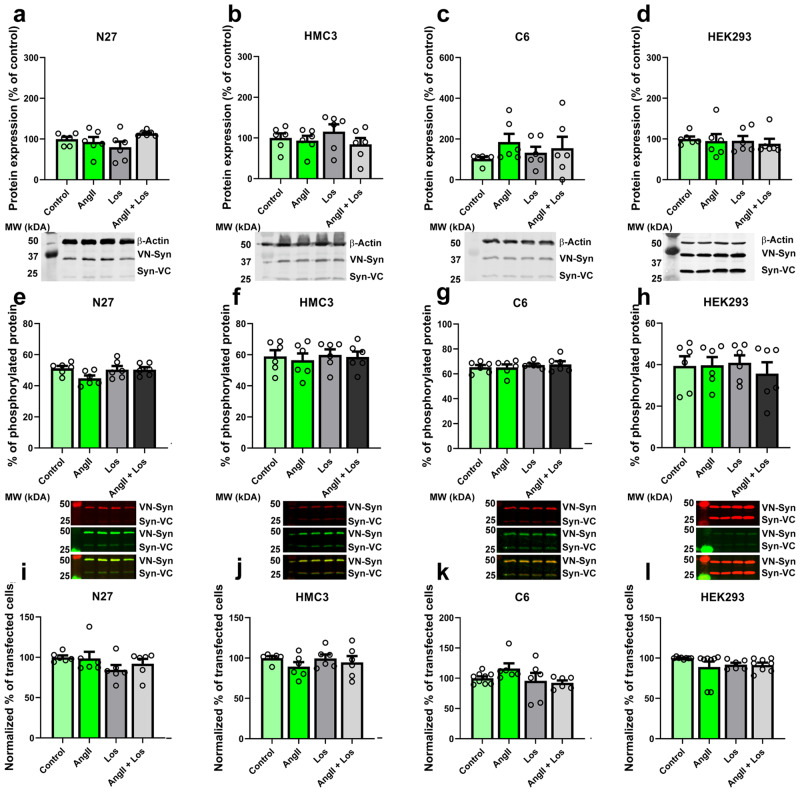
Fig. 4. Western blot analyses show no significant changes in α-synuclein expression neither in α-synuclein phosphorylation.
Cells were transfected with VNSyn/SynVC to measure both α-synuclein expression and transfection efficiency. a–d Western blot analyses of N27, HMC3, C6, and HEK293 cells with different treatments showed no significant changes due to the different treatments. N = 6. e–h Western blot analyses of N27, HMC3, C6, and HEK293 cells showed no differences in α-synuclein phosphorylation levels due to the different treatments. Green = Phosphorylated α-synuclein. Red = not phosphorylated α-synuclein. N = 6. i–l Flow cytometry analyses of the different cell treatments do not show any differences in α-synuclein transfection for VNSyn and SynVC plasmids. N = 6. AngII Angiotensin II, Los Losartan. One-way ANOVA and Tukey’s multiple comparison tests. Error bars represent SEM.

