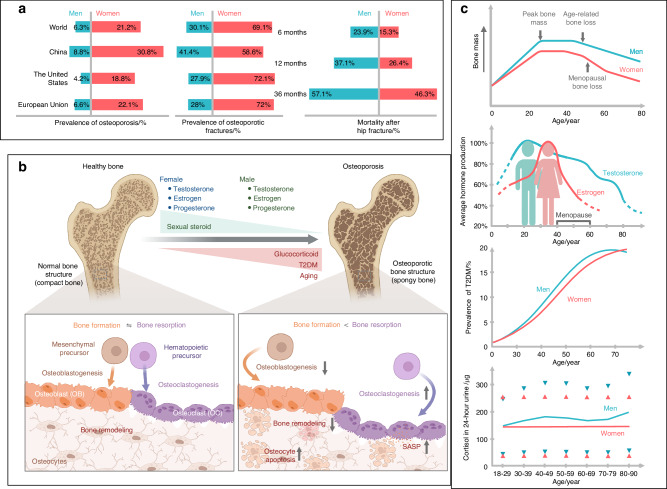
Fig. 1.
The prevalence of osteoporosis in men and women throughout their lifetimes. a Left: The prevalence of osteoporosis in women and men aged 50 and older in selected countries. The sex-specific prevalence rates of osteoporosis in the world, China, European Union (EU) countries, and the United States (US) are presented for women and men aged 50 years and older. The criterion of the World Health Organization was applied for the diagnosis of osteoporosis. The following data sources were used to determine osteoporosis prevalence: osteoporosis prevalence worldwide and in EU countries (https://www.osteoporosis.foundation/facts-statistics/epidemiology-of-osteoporosis-and-fragility-fractures); osteoporosis prevalence in China, the survey of the China Ministry of Health; and osteoporosis prevalence in the US, The Centers for Disease Control and Prevention. Middle: The sex-specific prevalence of osteoporotic fractures in selected countries. Unlike osteoporosis, the population-based prevalence of osteoporotic fractures is difficult to obtain for men and women by country due to the lack of standard diagnostic criteria. The data represent the proportions of hip fractures in men and women worldwide, China, EU countries, and the US. Data on hip fractures in China were adopted from a study in Hefei, China.526 Data for hip fractures worldwide, in EU countries, and in the US originated from the following data source: (https://www.osteoporosis.foundation/facts-statistics/epidemiology-of-osteoporosis-and-fragility-fractures). Right: The cumulative mortalities among male hip fracture patients were higher than those of female patients at 6, 12, and 36 months. Data were adopted from the study in Denmark.36 b The balance of bone formation and bone resorption changes during a lifetime due to decreased sex steroids, increased glucocorticoids, T2DM, and aging. Bone resorption can outweigh formation because of decreased osteoblastogenesis, enhanced osteoclastogenesis, reduced bone remodeling, and cell senescence. c Bone mass (upper), average sex hormone production (upper middle), prevalence of T2DM (lower middle), and urine cortisol levels (below) in men and women throughout their lifetime. The dots representing 24 h urine cortisol levels, shown as the 2.5th and 97.5th percentiles, were adapted from a study in Switzerland.48 SASP senescence-associated secretory phenotype

