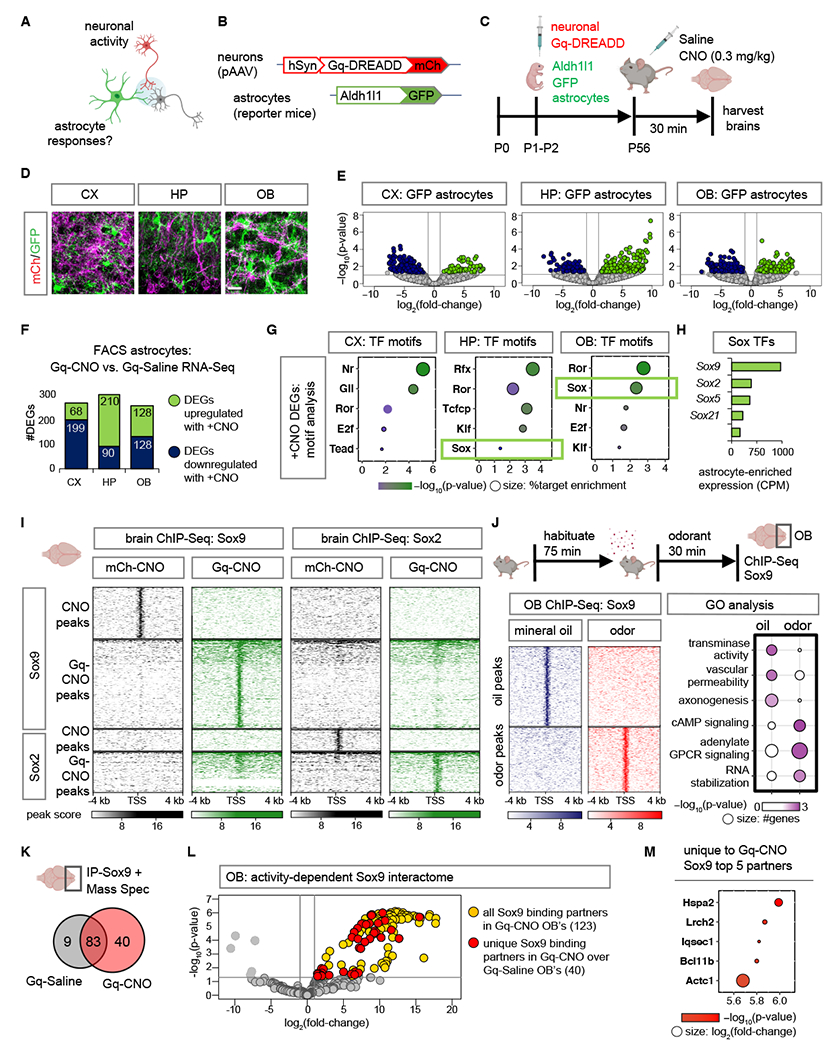
Fig. 1. Neuronal activity directs Sox9-regulated transcriptional responses in astrocytes.

(A-C) Schematic illustrating chemogenetic neuronal activation experimental design. (D) Sections showing distinct labeling of astrocytes (GFP) and Gq-DREADD neurons (mCh) in CX, cortex; HP, hippocampus; OB, olfactory bulb. Scale bar: 25 µm. (E) Volcano plots depicting RNA-Seq from GFP astrocytes comparing Gq-CNO vs. Gq-Saline. (F) Number of DEGs that are upregulated or downregulated in GFP astrocytes in Gq-CNO vs. Gq-Saline (n= 3/cohort, p< 0.05, log2fold-change 1). (G) Significant transcription factor (TF) motifs (p< 0.05) enriched in these DEGs and exhibiting astrocyte-specific expression. (H) Average transcript expression of Sox family TF’s in GFP astrocytes (CPM: counts per million). (I) Comparison showing heatmaps of ChIP-Sox9 and ChIP-Sox2 at 4 kb from peak center in Gq-CNO vs. mCh-CNO control (n= 3/cohort). (J) Schematic for odor evoked neuronal activation in the OB. Left panel: heatmaps of ChIP-Sox9 at 4 kb from peak center in mineral oil vs. odor exposed mice. Right panel: enriched gene ontology terms associated with these peaks (n= 6/cohort). (K) Sox9 binding partners in OB’s from Gq-CNO vs. Gq-Saline. (L) Volcano plot depicting IP-MS (IP-Mass Spectrometry) data of Sox9 interactome in Gq-CNO. Fold change was calculated over control lysates incubated with beads only without antibody. Sox9 binding partners unique to Gq-CNO vs. Gq-Saline are highlighted in red (n= 9–12/cohort, p< 0.05, log2fold-change >1). (M) Top 5 Sox9 interactors unique to Gq-CNO (p< 0.0001, log2fold-change >8.5). Color code represent p-values (x-axis), and size represent log2fold-change with larger circles denoting greater binding affinity.
