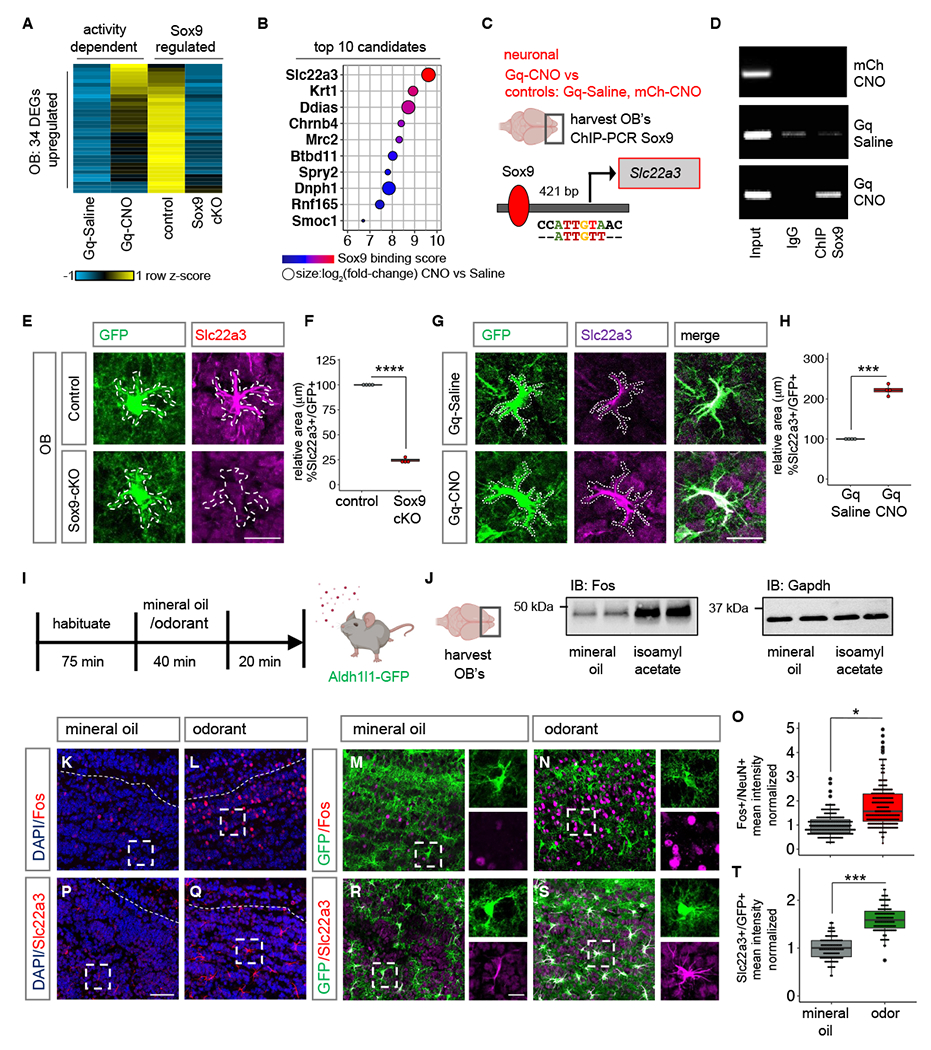
Fig. 2. Neuronal activation induces Slc22a3 in OB astrocytes.

(A-B) Heatmap depicting the 34 neuronal activity-dependent and Sox9 regulated DEGs (n= 3, p< 0.05), and the top 10 candidates filtered by Sox9 motif binding score 1000 bp from transcription start site of candidates. (C-D) ChIP-PCR screen identifying activity-dependent Sox9 regulation at Slc22a3 promoter (n= 4-6 OB). (E-H) Slc22a3 expression in control vs. Sox9-cKO OB astrocytes and in Gq-Saline vs. Gq-CNO; and box plots depicting area covered by Slc22a3 in GFP astrocytes (average of 116-122 cells/cohort, ****p= 1.93E-08; ***p= 0.00013, unpaired Student’s two-tailed t-test on n= 4 mice/cohort); Scale bar: 20 µm. (I) Schematic illustrating odor-evoked neuronal activation experimental design. (J) Immunoblots of Fos and loading control from OB lysates (n= 4/cohort). (K-O) Immunostaining of Fos in Aldh1l1-GFP mice and quantification of mean fluorescence intensity in NeuN+ neurons (244-250 cells/cohort, *p= 0.0285, Wilcoxon rank sum test on n= 4 mice/cohort). (P-T) Immunostaining of Slc22a3 in Aldh1l1-GFP mice and quantification of mean fluorescence intensity in GFP+ astrocytes (130-131 cells/cohort, ***p= 0.00039, unpaired Student’s two-tailed t-test on n= 4 mice/cohort). Scale bar: 50 µm; inset: 10 µm. Dashed line represents boundary of granule cell layer. See Table S3 for data summary.
