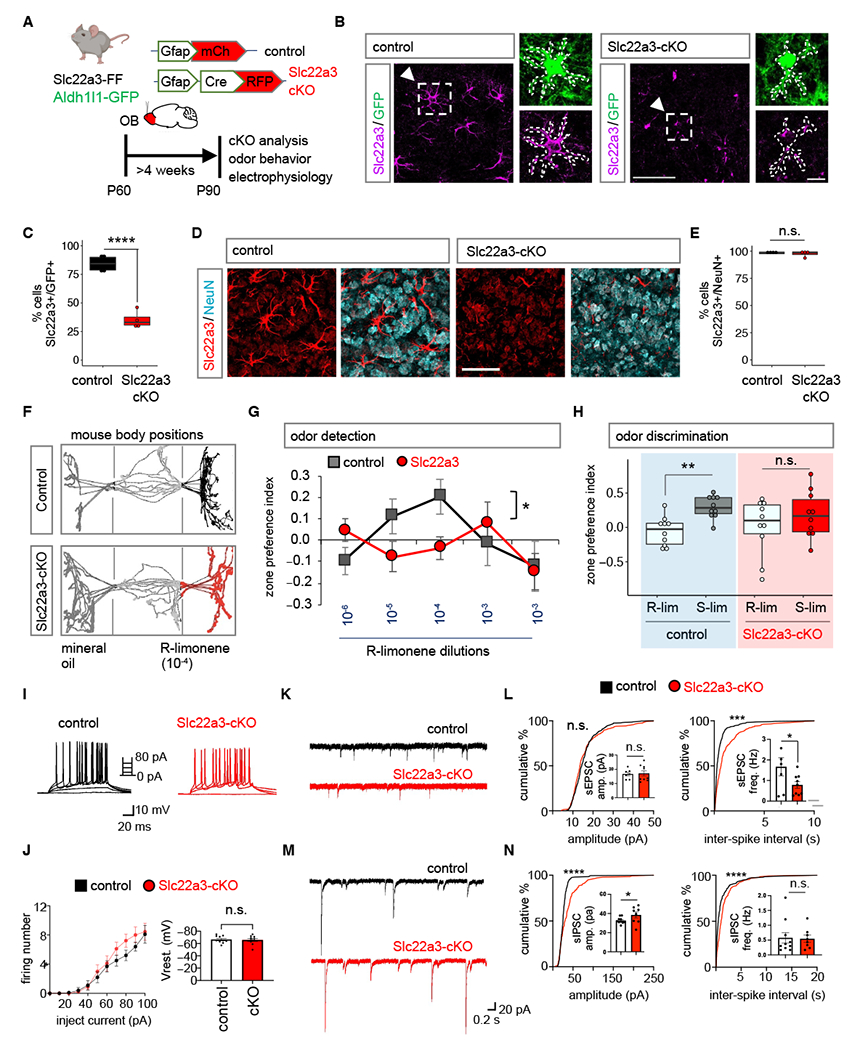
Fig. 3. Astrocytic Slc22a3 regulates olfactory circuit function.

(A) Schematic illustrating viral vectors used for Slc22a3 conditional deletion from OB astrocytes. (B-E) Immunostaining and quantification of Slc22a3 in GFP+ astrocytes (average of 83-93 cells/cohort, ****p= 9.59E-05, unpaired Student’s two-tailed t-test on n= 4 mice/cohort); and in NeuN+ neurons (average of 350-363 cells/cohort, p= 0.5828, unpaired Student’s two-tailed t-test on n= 4 mice/cohort). Scale bar: 50 µm, inset: 10 µm. (F) Schematic illustrating live mouse tracking in three-chamber assay for odor detection. Top represent a control mouse exploring R-limonene (R-lim) at dilution of 10−4, while bottom represent Slc22a3-cKO mouse showing no preference for same R-lim concentration. (G) Quantification of odor detection in control and Slc22a3-cKO mice (n= 10/cohort, *p= 0.0211; two-way repeated measures ANOVA with Sidak multiple comparison). (H) Quantification of odor discrimination between R-lim and S-limonene (S-lim) from the same cohorts of mice (n= 10/cohort, **p= 0.0052; two-way repeated measures ANOVA with Sidak multiple comparisons). (I-J) Whole-cell patch clamp electrophysiology of granule cells firing number from stepped current injections (n= 3, 10 cells/cohort, p= 0.0578, two-way ANOVA with Sidak’s multiple comparison correction). (K-L) Traces and summary data of amplitude and frequency from sEPSC recordings (7-9 cells/cohort, sEPSC amplitude p= 0.7546; sEPSC frequency *p= 0.0473, unpaired Student’s two-tailed t-test on n= 3 mice/cohort; ****p< 0.0001); Kolmogorov-Smirnov (K-S) test. (M-N) Traces and quantification of amplitude and frequency from sIPSC recordings (8-10 cells/cohort, sIPSC amplitude *p= 0.0164, sIPSC frequency p= 0.8095, unpaired Student’s two-tailed t-test on n= 3 mice/cohort ****p< 0.0001 K-S test). All recordings in (L, N) are in granule cells and data is presented as mean ± SEM. See Table S3 for data summary.
