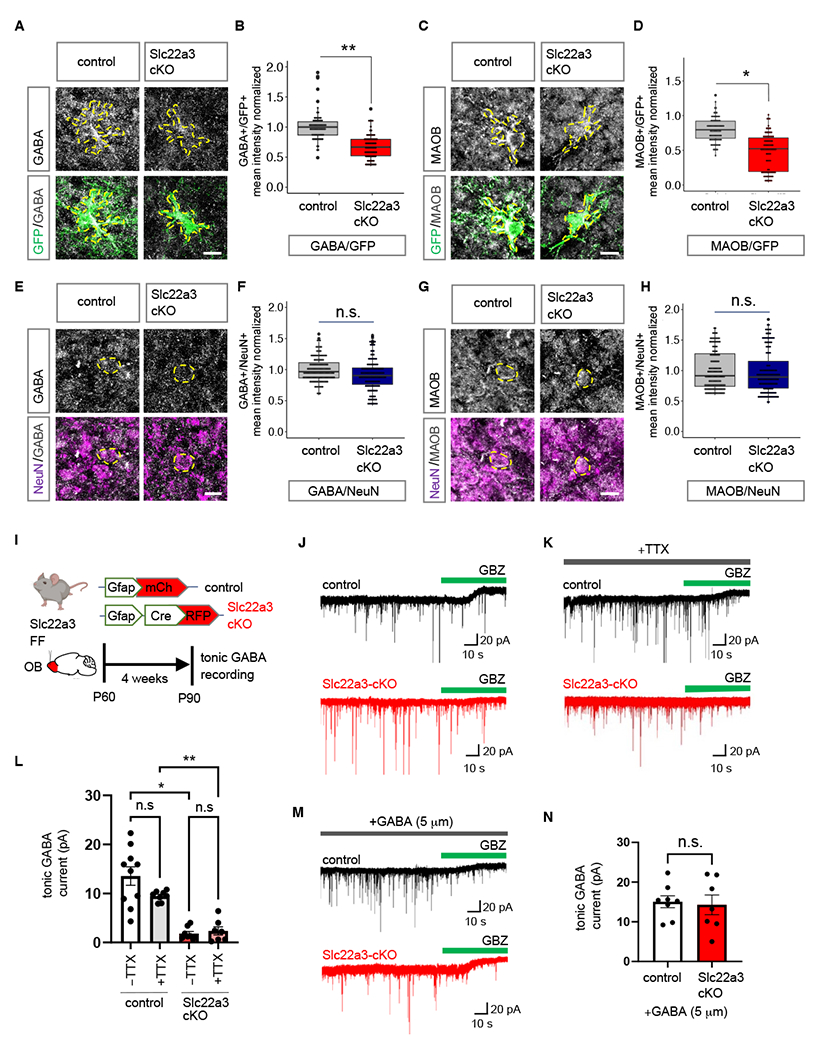
Fig. 6. Slc22a3 regulates tonic GABA release from OB astrocytes.

(A-H) Immunostaining and quantification of GABA and MAOB in control vs. Slc22a3-cKO (A-D) GFP+ astrocytes (73-88 cells/cohort; GABA **p= 0.0032, MAOB *p= 0.0121) and (E-H) NeuN+ neurons in the OB (144 cells/cohort; GABA p= 0.2119, MAOB p= 0.9355); unpaired Student’s two-tailed t-test on n= 4 mice/cohort. Scale bar: 10 µm. (I) Schematic illustrating viral vectors and timelines for tonic GABA current measurement experiments. (J-K) Traces of tonic GABA currents in granule cells in OBs from control and Slc22a3-cKO treated with gabazine (GBZ, 20 μM), with or without TTX (0.5 μM). (L) Quantification of tonic GABA current (7-10 cells/cohort, −TTX *p= 0.0331, +TTX **p= 0.0056) (M-N) Traces and quantification of measurement of tonic GABA current in presence of GABA (7-8 cells/cohort, p= 0.8483); unpaired Student’s two-tailed t-test on n= 3 mice/cohort. Data presented as mean ± SEM. See Table S3 for data summary.
